9. Thermal comfort in dwellings, schools and housing for the elderly
9.1 Introduction
Most of the research on thermal comfort has been conducted in offices, but in recent years there has been an increased focus on research in homes, schools or residential and care centers for the elderly. Because the adaptive opportunities in such environments are different from those in offices and age and health can vary greatly, acceptable, comfortable and healthy temperature ranges can therefore also be different.
9.2 Thermal comfort in dwellings
More than in other types of buildings, occupants of dwellings have the most flexible adaptive opportunities available to feel comfortable in a wide range of conditions18.
Figure 9.1 shows the results of a comparative analysis of thermal comfort in about 100 dwellings and about 700 different types of free-running buildings. The mean neutral temperature of the dwellings (the dashed line) and all but one of the neutral temperature per dwelling (the squares) fall within the 95% zone of the entire database. This means that thermal comfort in (free running) homes is related to the outdoor temperature in the same way as in other free running buildings (Nicol, 2016).
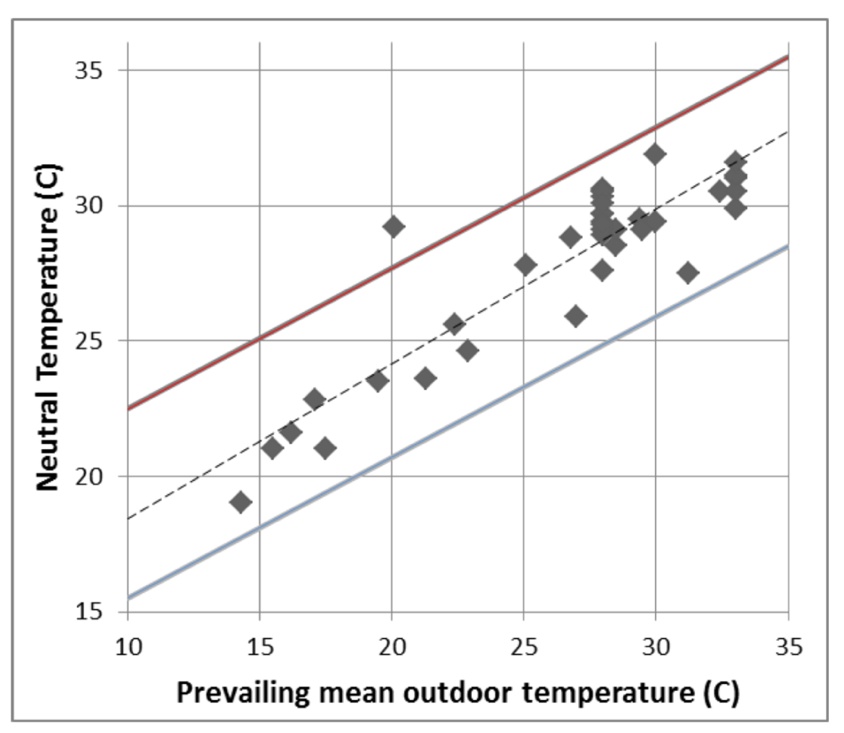
Figure 9.1: Neutral temperatures in free-running dwellings (the squares) and the corresponding regression line (dotted line). The neutral temperatures fall largely within the 95% confidence interval of the entire thermal comfort database. This is the interval between the red and blue line. Source: Nicol, 2016.
The differences in neutral temperatures between homes are greater than for other building types because people in homes form a more heterogeneous group than people in office buildings and their behaviour at home is different from that in the office. At home, the adaptive opportunities are greater because of the greater freedom to adjust and vary clothing, to change the temperature setting, to use sun blinds, to open or close windows and doors, to go to another room with a different temperature or to sit on a balcony, terrace or in the garden.
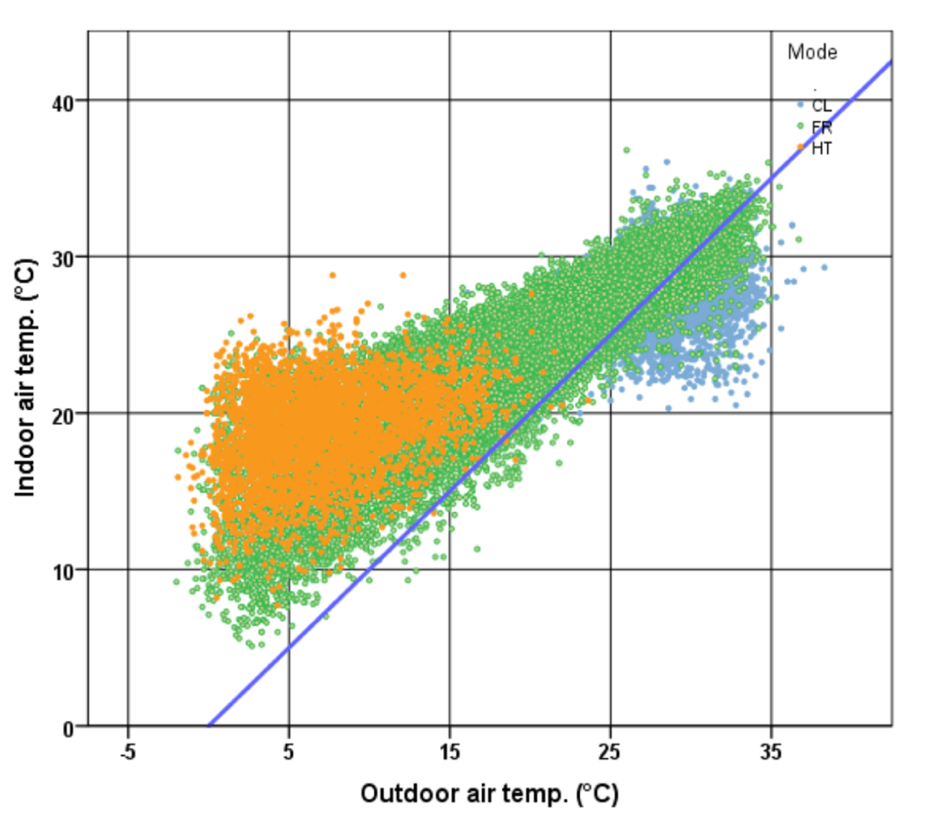
Figure 9.2: Temperature clouds for Japanese homes. HT, orange=heated; CL, blue=cooled; FR, green=free running, not heated and not cooled. The blue line indicates where the indoor temperature equals the outdoor temperature. Source: Rijal, Humphreys & Nicol, 2015.
Figure 9.2 shows the observed temperatures in homes where heating (HT, orange), cooling (CL, blue) and no heating and no cooling, i.e. free running (FR, green), are taking place. Below an outdoor temperature of around 17°C, heating takes place and the internal temperatures then vary between around 10°C and 25°C, a bandwidth of 15°C. Here, a more or less horizontal boundary can be observed at an indoor temperature of about 25°C. In dwellings with air-conditioning, cooling takes place at outdoor temperatures above about 17°C, leading to indoor temperatures of between 20°C and 30°C. Here, also horizontal boundary exists at an indoor temperature of about 20°C. In dwellings where no cooling and/or heating is provided, the indoor temperature range is more diverse, from around 5°C to 35°C, at outdoor temperatures between 0°C to 35°C because here the temperature is controlled exclusively by passive means and is therefore more related to the outdoor temperature (Rijal, Humphreys & Nicol, 2015).
Analysis of surveys in homes in England, Saudi Arabia and Japan show 3 temperature “areas” of homes that are heated (Japan and England), cooled (Japan and Saudi Arabia) and free running (England and Japan) (Figure 9.3). The heated and cooled areas have a larger indoor temperature bandwidth (15K) than that of the free-running areas (8-10K). This contradicts the expected shape in standards and guidelines which assume that conditioned buildings have a narrower bandwidth.
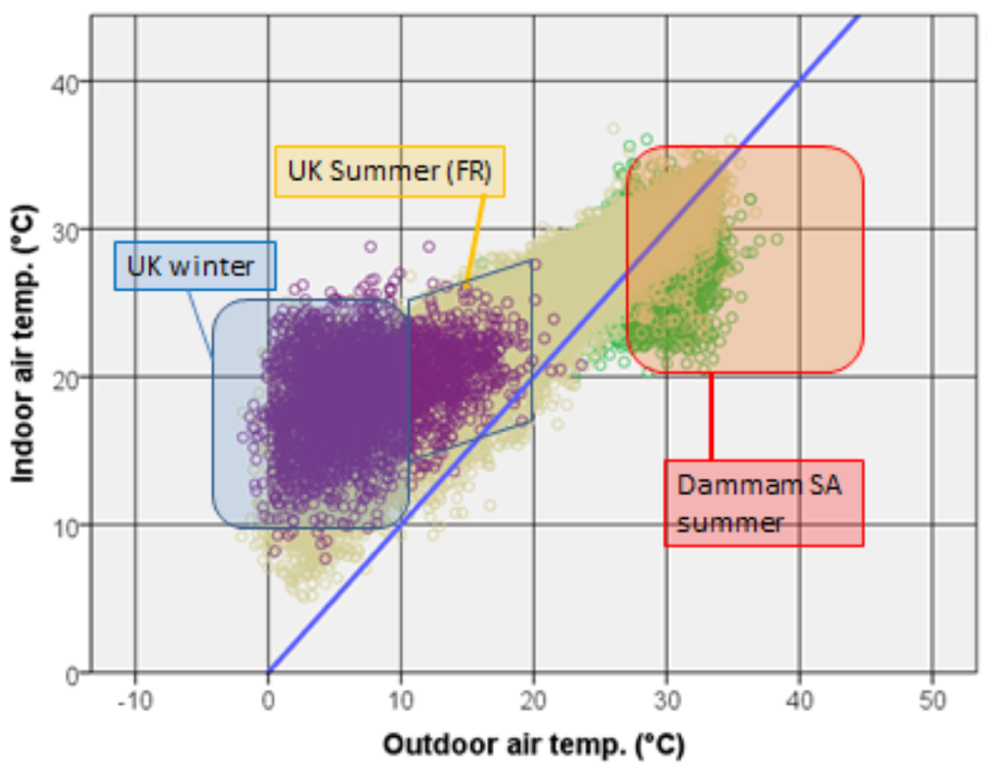
Figure 9.3: Merged results of English and Japanese heated homes (purple), English and Japanese free-running homes (yellow) and residential cooled homes from Japan and Saudi Arabia. The blue line indicates where the indoor temperature equals the outdoor temperature. Source: Nicol, 2016.
The reason for these temperature differences in homes with the temperature ranges in the current standards is that residents themselves have full control over their indoor climate and installations and also have to pay the necessary energy costs for this themselves. As a result, residents are also more motivated to adapt their clothing to the weather conditions and temporarily accept a lower level of comfort (and thus save energy) (Nicol, 2016).
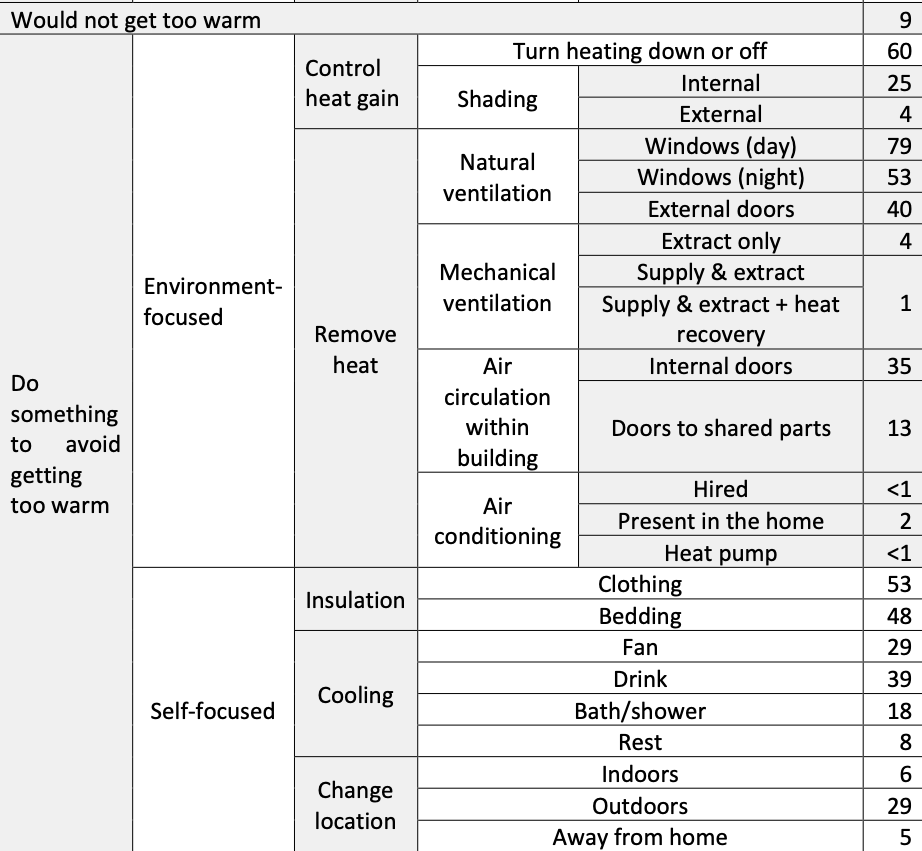
A study in over 2300 homes in England examined the behaviour of residents during hot weather (Raw, 2018). When asked what residents do in summertime conditions (not a heat wave) to keep from getting too hot, 29% answered that they use blinds, 79% open the window during the day and 53% at night, while 40% open the exterior doors and 35% open the interior doors. In addition to these adaptive measures on the dwelling, the occupants made various personal adjustments: 53% adjusted their clothing, 48% slept under thinner bedding, 29% used a ventilator, 39% used cold drinks, 18% took a bath or shower and 6% went somewhere else to sit indoors and 29% went outdoors (Table 9.1).
Table 9.1: Strategies people take to avoid getting too hot in 2,300 homes in the UK. Source: Raw, 2018.
What is striking is the great diversity of measures that people take to avoid getting too hot. In the event of a heat wave, more residents took various additional adaptive measures to avoid getting too hot (Figure 9.4).
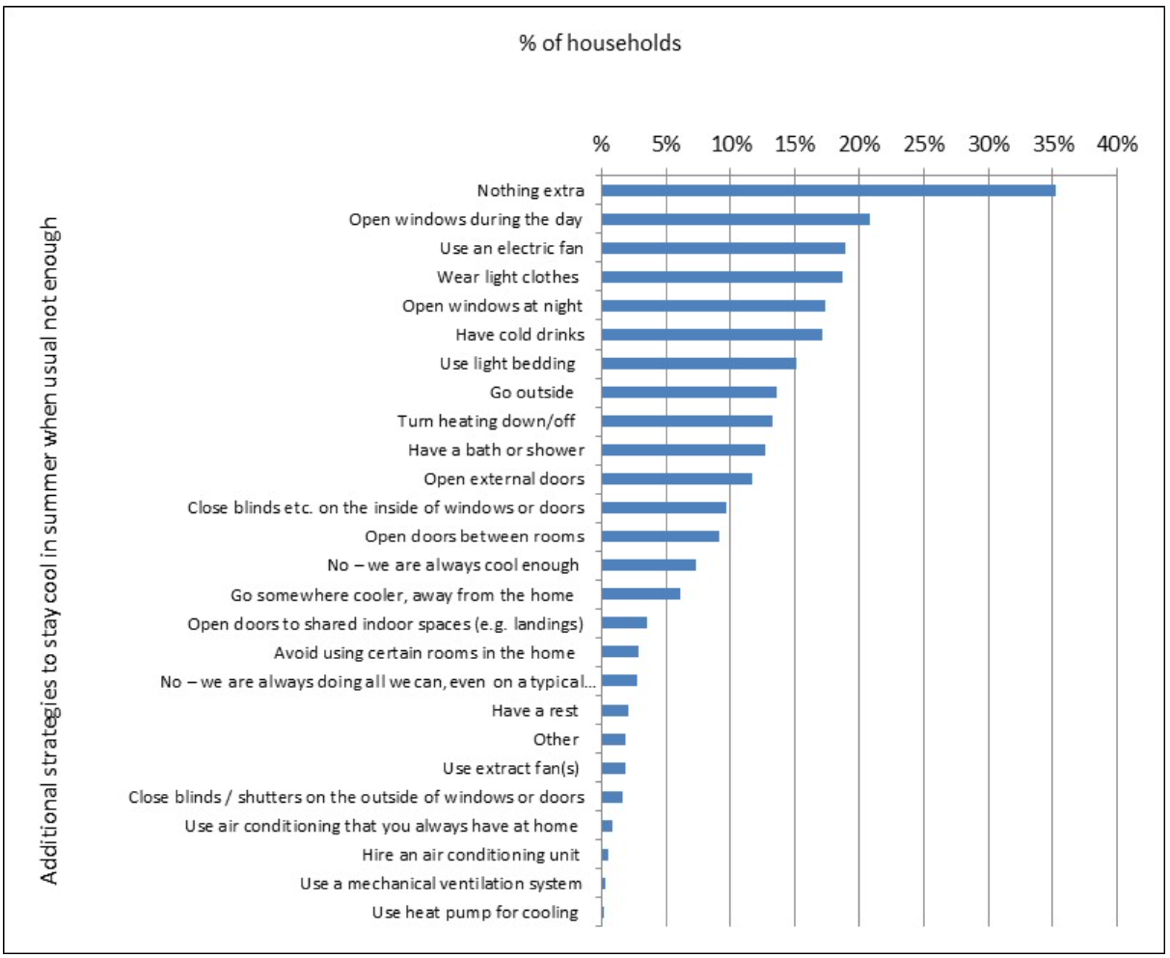
Figure 9.4: Percentage of households taking additional measures in the event of a heat wave. Source: Raw, 2018.
The temperature in bedrooms deserves special attention. People sleep on average about one-third of the time and the quality of sleep affects the recovery from physical and mental fatigue that has occurred during the day (Li & Lan, 2016). Insufficient quality of sleep is associated with reduced cognitive performance in the elderly and learning performance in children. Poor sleep also increases the risk of obesity, type 2 diabetes and cardiovascular disease (Nigai et al., 2010; Kingma et al., 2012) and adversely affects the immune system (Opp, 2009). In addition to too much light, too much noise and poor air quality, temperature also affects the quality of sleep. The temperature directly around the human body should be lower than approximately 30°C to enable comfortable sleep. The combination of bed clothing, sheets and duvet determines this temperature together with room temperature and air velocity and are the available adaptive options to enable a comfortable sleep (Nicol, 2019). Adequate thermal insulation therefore makes it possible to sleep comfortably at very low temperatures, but in a very warm environment there is a limit to the exclusion of thermal insulation.
9.3 Thermal comfort in Schools
The quality of the indoor environment (thermal comfort, air quality, acoustics, light) in classrooms influences learning performance (Bluyssen, 2009, 2013). This means, among other things, that, partly in view of the future higher temperatures in summer, the more frequent and more intense heat waves (Montazami & Nicol, 2013) and the current poor quality of the indoor air quality and climate in existing schools (Bluyssen, et al., 2018), guidelines on ventilation and (adaptive) comfort are needed specifically for school buildings (Teli et al., 2017). Children have a lower metabolism than adults for the same activities (Havenith, 2007). This seems to be due to a smaller body volume/surface area ratio of younger children, which makes their heat loss relatively higher. Also, children produce less sweat than adults but have a higher skin temperature, so children can lose less heat through sweat evaporation and rely more on heat loss through convection and radiation (Almeida et al., 2016; te Kulve et al., 2020). However, under everyday conditions, children are more active (playing outside during school breaks and after school) than adults for a significant part of the day. In children, an mean metabolism of 1.5 Met has been observed (de Dear et al., 2015), while adults have a metabolism of 1.2 Met on average when doing office work. In terms of thermal insulation, clothing worn by younger children is more flexible than that worn by adults, which means that clothing insulation is better suited to the prevailing temperatures (de Dear, 2015). However, on the other hand, especially younger children are partly dependent on their caregivers when it comes to clothing choice (Folkerts, 2019) and therefore children may be limited in their adaptive capabilities (Teli, 2012).
Research on children's thermal comfort and thermal preference has examined the association of subjective temperature perceptions with physical measurements of the environment. The question is to what extent children are able to express their thermal feelings in the same subtle way as adults19. There is evidence that young children tend to vote more on the extreme categories of a 7-point scale (e.g. Table 2.1), while students who have some knowledge of the indoor environment give a more nuanced rating (Hellwig, 2017). Other research concluded that children aged 7 to 11 were able to understand child adapted scales (pictures instead of text) for thermal sensation and preference because few conflicting and missing values for the subjective ratings of the thermal environment were found (Teli et al., 2013).
Looking at individual studies of thermal comfort in children, for example, a study in a naturally ventilated kindergarten found that children preferred lower temperatures than the PMV model indicates (Yun et al., 2014). A study in Australian primary and secondary schools found that the neutral and preferred temperature was around 22.5°C on average, lower than the PMV and adaptive model predict (de Dear et al., 2015). The bandwidth of acceptable temperatures around the mean is greater, indicating a broad adaptive capacity in children (Teli et al., 2013; Humphreys et al., 2007). In a study in naturally ventilated classrooms with children between 7 and 11 years old, the subjective ratings were compared with the adaptive comfort model. In summer, children preferred lower temperatures compared to the adaptive EN15251 standard (Teli et al., 2012). In another study in English schools where measurements were assessed using the adaptive model of EN-15251, the schools were found to meet the standard, but when the results were assessed using an adaptive model adapted for children, there were significantly more exceedances of the acceptable temperature range. This adaptive thermal comfort model for children was developed because of the physiological differences between children and adults (Teli et al., 2017). Although children on average find it warmer than adults, it appears that children are less sensitive to temperature variations when exposed to changing temperatures in naturally ventilated, not air-conditioned, classrooms than children in air-conditioned classrooms (de Dear et al., 2015). This corresponds to the effect found in adults in naturally ventilated and air-conditioned environments (see Section 4.3).
A study in 32 naturally ventilated classrooms in England found that compared to adults, children's comfort temperature was 1.9°C lower during summer and 2.8°C lower during the heating season (Korsavi & Montazami, 2020). During the heating season, children exhibit less personal adaptive behavior than outside the heating season. Teachers are primarily responsible for regulating classroom temperature based on their perception of the thermal environment and not on the perception of the children. The researchers recommend that new schools or renovations consider opportunities for adaptive behavior as part of the design process, targeting both teachers and children. Teachers should be aware that children have lower comfort temperatures than adults and should motivate children to communicate about this and use adaptive options.
Analyses of the ASHRAE Global Thermal Comfort Database II (Figure 8.12, bottom left) show that for children in schools in winter, the lower limit of both the PMV model (ISO-7730, Category B) and the adaptive model (EN15251, Category II) correspond reasonably well to the measured actual acceptability, but that temperatures of about 3°C above the PMV upper limit for winter still appeared acceptable. In summer, the acceptable temperature range for children matches both the PMV model (ISO-7730) and the adaptive model (EN1525), but the mean comfort temperature is well below the mean of the prescribed ranges (Li et al., 2019).
9.4 The elderly and thermal comfort
During heat waves, more people are admitted to hospital and more people die than in an average year. Inevitable physiological and mental changes occur as people age. Metabolism slows down and the skin, where the thermoreceptors are located, becomes less sensitive, which can alter thermal perception (Blatteis, 2012). Physical ageing in general leads to less efficient defence mechanisms against (extreme) temperatures, which can lead to an impaired thermal balance of the body and to health problems. This is reinforced when people also become mentally less resilient. In addition, there are differences in the quality of homes and, in combination with large income differences, it can be difficult and expensive for some of the elderly to feel (thermally) comfortable in their homes (Day, 2015; Van Hoof et al, 2010). In addition, the energy transition will result in many residential buildings being equipped with innovative climate systems. For example, a system with a heat pump and low temperature heating can provide a more stable and uniform indoor climate, but it is not known whether this will lead to a different comfort experience for (older) residents (Rudge, 2012). With such systems, it may take longer for the temperature to reach a set point and it is often not possible to overcompensate quickly and briefly when, for example, someone is too cold (and Allieshesia is not possible, see Section 4.6). Sitting together by the heater on a cold winter's day or hanging something to dry on the radiator is no longer possible. This is somewhat similar to the 1960s and 1970s when coal and gas fireplaces had to make way for central heating (Fernandez-Galiano, 2000). Heavily insulated façades, without opening windows, can create a risk that elderly, less mobile residents are deprived of contact with outdoor conditions and, for example, can no longer feel and hear a breeze from outside, smell the plants and flowers in the garden or hear the sound of birds singing or children playing. Being deprived of such sensory stimuli can have a negative effect on the health and wellbeing of elderly people who, for various reasons, are no longer able to walk and cannot spend time outside.
Simulations with an elderly adjusted thermoregulation model show that perceived thermal conditions influence the body's thermal state. Elderly people who, from a neutral situation, are subjected to prolonged exposure to cold conditions cool down so much that this cannot be corrected with warm clothing, and when they move to warmer conditions it takes much longer for the body to return to its original thermal state (Henshaw & Guy, 2015). Furthermore, a study in 57 homes with 71 residents over 65 years of age showed, for example, that women had a lower neutral temperature (23.6°C) than men (25.1°C) and that older people over 85 years of age more often found it warmer or colder than neutral than the younger group (65-69 years). The group that had more fragile health reported being too cold more often (Martins et al., 2020). A study in 6 care homes in south-eastern Australia with a total of 322 residents found that, on average, residents preferred a 0.9°C lower temperature and wore more clothing compared to the average adult population (Tartarini et.al., 2018). However, most residents were able to optimise their thermal comfort through adaptive measures, such as varying clothing and using fans and opening and closing windows. Furthermore, it appeared that the residents preferred lower temperatures than the upper limit of the adaptive thermal comfort model and the researchers argue that a linearly increasing upper limit without an absolute limit may not be applicable to the group of elderly people in care homes.
There is therefore increasing evidence that special attention should be paid to the thermal needs and preferences of different groups of older people in the design and operation of housing for the elderly (Shibasaki et al., 2013).
18 Of course, the quality of the home is crucial here. Poor insulation, limited access to windows, poor outdoor air quality, little personal space and a poor heating system are examples of aspects that make it difficult to adapt, which can result in comfort and health issues.
19 For example, the differences between “neutral”, “slightly warm”, “warm”, and “hot”.