8. New perspectives resulting from Thermal Comfort Database II
8.1 Introduction
The results of field studies (Humphreys, 1975; de Dear et al., 1997; Nicol, & Humphreys, 2005) have led to a more realistic view of thermal comfort than the climate chamber models (Fanger, 1970) and to expanding standards to include opportunities for more adaptive approaches to indoor climate. Since the turn of the century, the amount of field research has increased enormously, not only in Europe and the United States, but also in Asia, South America and Africa. All this research of the last two decades has been collected in a global database: ASHRAE Global Thermal Comfort Database II (Földváry Ličina et al., 2018), which also includes data from RP-884 and SCATs (Chapter 3). Figure 8.1 shows the field surveys from database II classified by climate, continent and season.
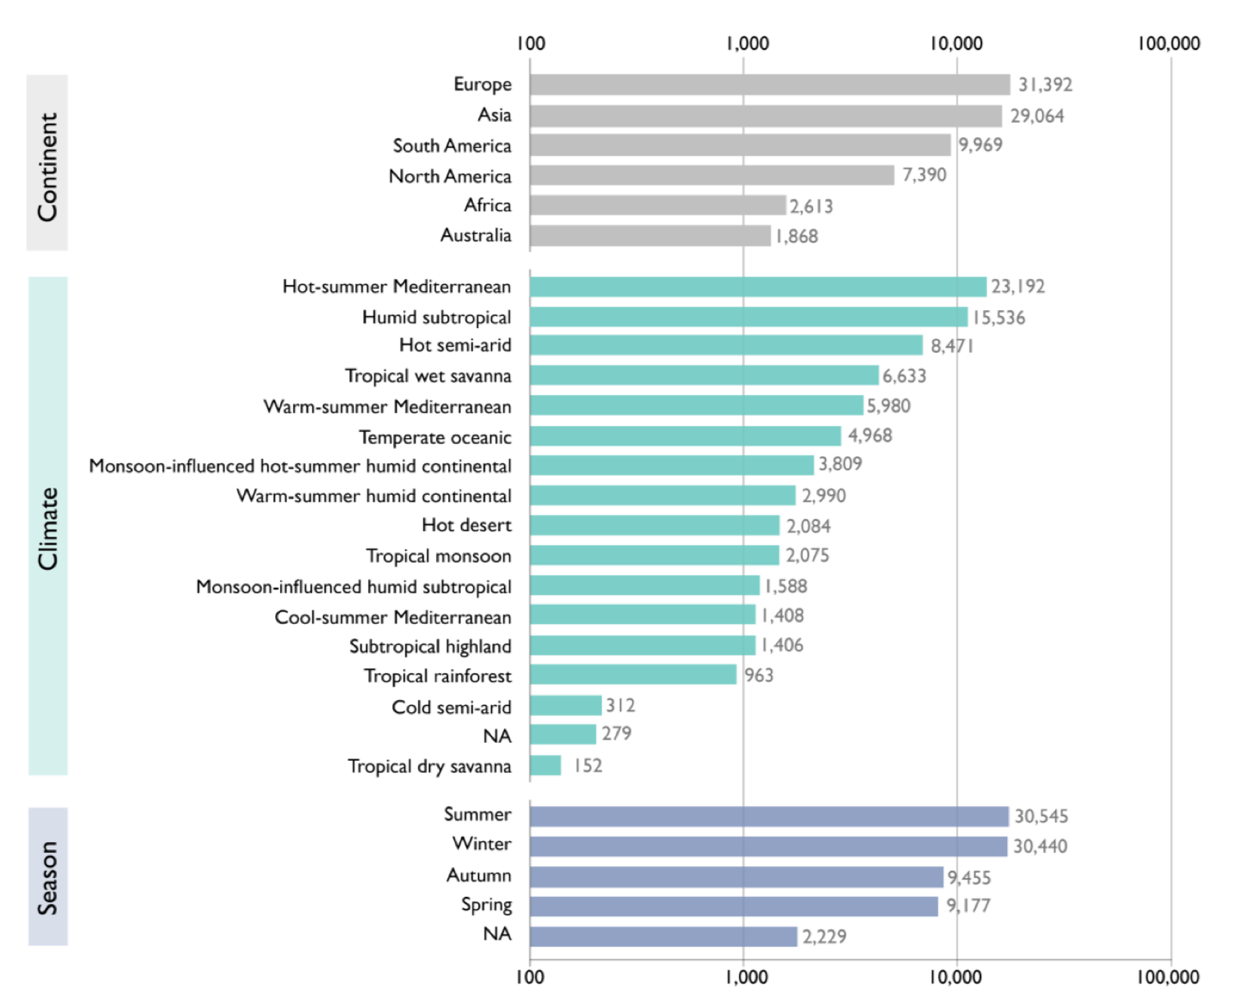
Figure 8.1: Distribution of field surveys by continent, climate and season. Climate is classified according to Köppen's classification system, the horizontal axis is a logarithmic scale. The numbers on the X axis are “records”. Source: Földváry Ličina et al., 2018.
The first database from 1998, RP-884, on which the adaptive ASHRAE standards are based, consisted of over 20,000 data points distributed across 8 countries on 4 different continents and 11 climate zones, according to the Köppen classification. At the time of the new analyses (2019), the current database consists of more than 107,000 records15 distributed across 29 countries on 6 different continents and 16 climate zones. With this more extensive and geographically better distributed database, new analyses examine the following aspects of thermal comfort in buildings:
The validity of the indoor climate categories;
The validity of the PMV/PPD model;
The validity of the original RP-884 based adaptive comfort model;
The applicability of the adaptive model to building types other than naturally ventilated/non-air-conditioned/free-running buildings;
The influence of humidity on thermal comfort;
The differences in thermal comfort in different parts of the world;
Possible improvement of the current practice of operating HVAC systems to enable energy savings.
The database is public and available online in order to carry out analyses: https://cbe-berkeley.shinyapps.io/comfortdatabase/.
8.2 The validity of the indoor climate categories
Chapter 7 outlined the objections to divide the indoor climate into quality or expectation categories. Using the ASHRAE Global Thermal Comfort Database II, it was possible to analyse the validity of the indoor climate categories, based on the PMV/PPD relationship, more precisely to better substantiate the empirical objections. Figure 8.2 shows that the differences in acceptability expressed by the PMV categories in the standards do not in reality give significant differences in the rates of acceptability or comfort (Li et al., 2019).
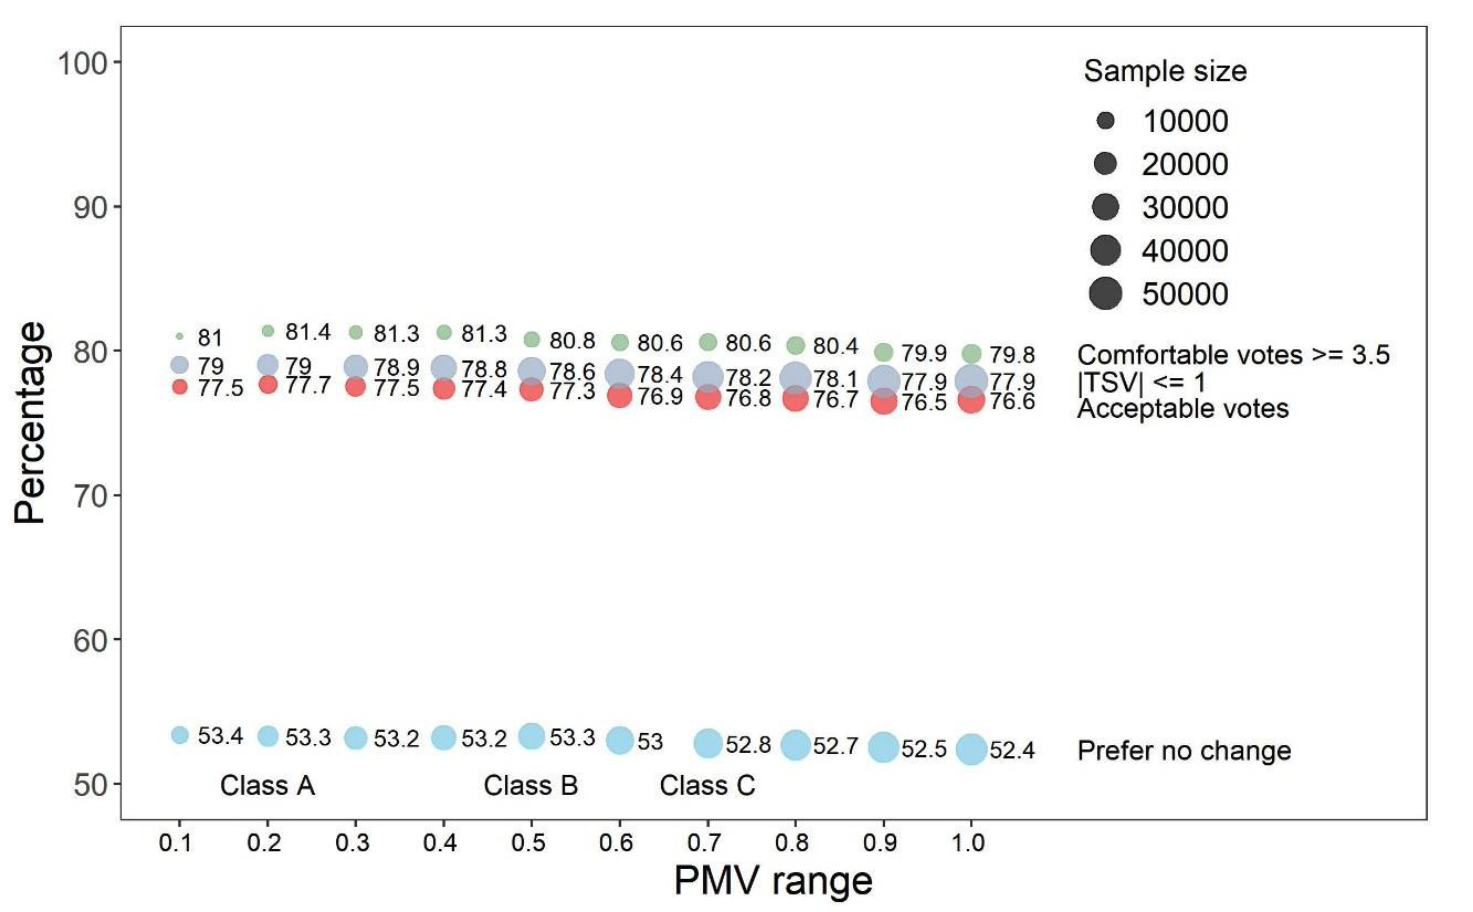
Figure 8.2: Actual percentages of comfort (green dots), thermal sensation (TSV) (grey dots), acceptability (red dots) and “prefer no change” (blue dots) compared to the PMV categories (Category A: +/- 0.2; Category B: +/- 0.5; Category C: +/- 0.7). Source: Li et al., 2019.
It is clear that thermal comfort in buildings is achieved over a wide PMV bandwidth and that an indoor climate does not become more comfortable the closer PMV or temperature boundaries are controlled. This is a further confirmation of the results of Ahrens et al. (2010) in Table 7.1 and Table 7.2. The recently developped thermophysiological theories assume a thermoneutral zone within which comfort is achieved by physiological adaptation in combination with behavioural adaptive measures (Kingma, 2014; Parkinson, 2016).
8.3 The validity of the PMV/PPD model
One of the important findings of the analysis of the ASHRAE Global Thermal Comfort Database II is that the PMV/PPD model has low accuracy in predicting thermal comfort, both at the group and individual level. The explained variance (R2) of the Observed Thermal Sensation by the PMV is low: 8%. The overall accuracy of the PMV model is found to be 34%. Even around “neutral”, where the PMV is considered most accurate, the accuracy is below 60%. Figure 8.3 shows the main results of the analysis (Cheung, et al., 2019).
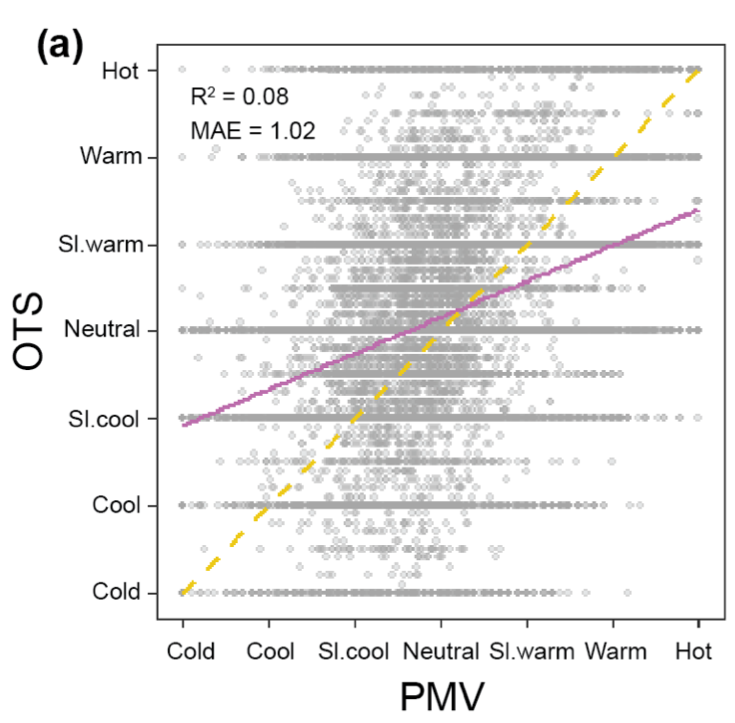
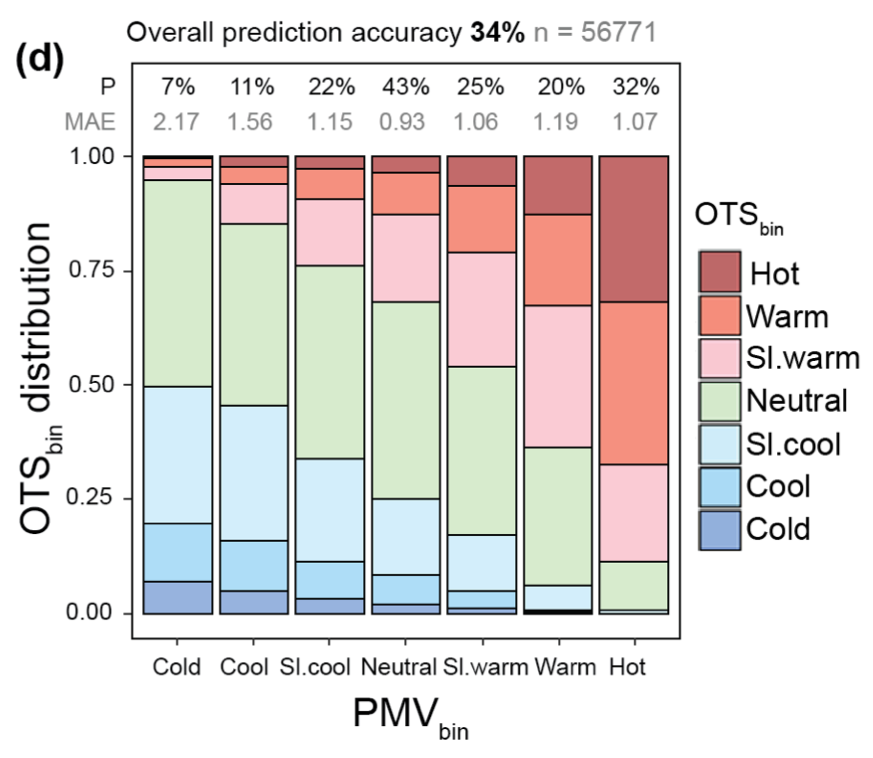
Figure 8.3: Analysis of the relationship between the Observed Thermal Sensation (OTS) and PMV. (a)= Raw data plot between OTS and PMV; (d)= Grouped OTS (OTSbin) at each PMVbin category with the overall prediction accuracy (P) and mean absolute error (MAE) at each PMVbin category16. Source: Cheung et al., 2019.
The database is composed of data collected by many researchers who have followed different procedures and used different equipment and measuring method, for example, temperature, air velocity, metabolism and clothing insulation. These are potential sources of inaccuracies in the PMV/PPD model and raise the question of how reliable and robust the PMV model is when trained researchers cannot obtain correct results. Cheung, et al. (2019) concludes that, given its complexity, the PMV model has an unacceptably low prediction accuracy and that there is a need for simpler, non-deterministic models that better predict people's comfort in the built environment.
To further investigate the validity of the PMV model, Figure 8.4 compares the actual observed percentage of dissatisfied with the classical PMV/PPD curve (Figure 2.2). The actual percentage of dissatisfied is not as sensitive to thermal sensation as the PMV/PPD predicts, which is evident from the flatter lines compared to the PPD. This confirms the previously mentioned observation that narrower comfort categories around PMV=0 do not give higher comfort in practice. Moreover, the lowest observed percentage of dissatisfied is around 20%, much higher than the 5% predicted by the PMV/PPD relation.
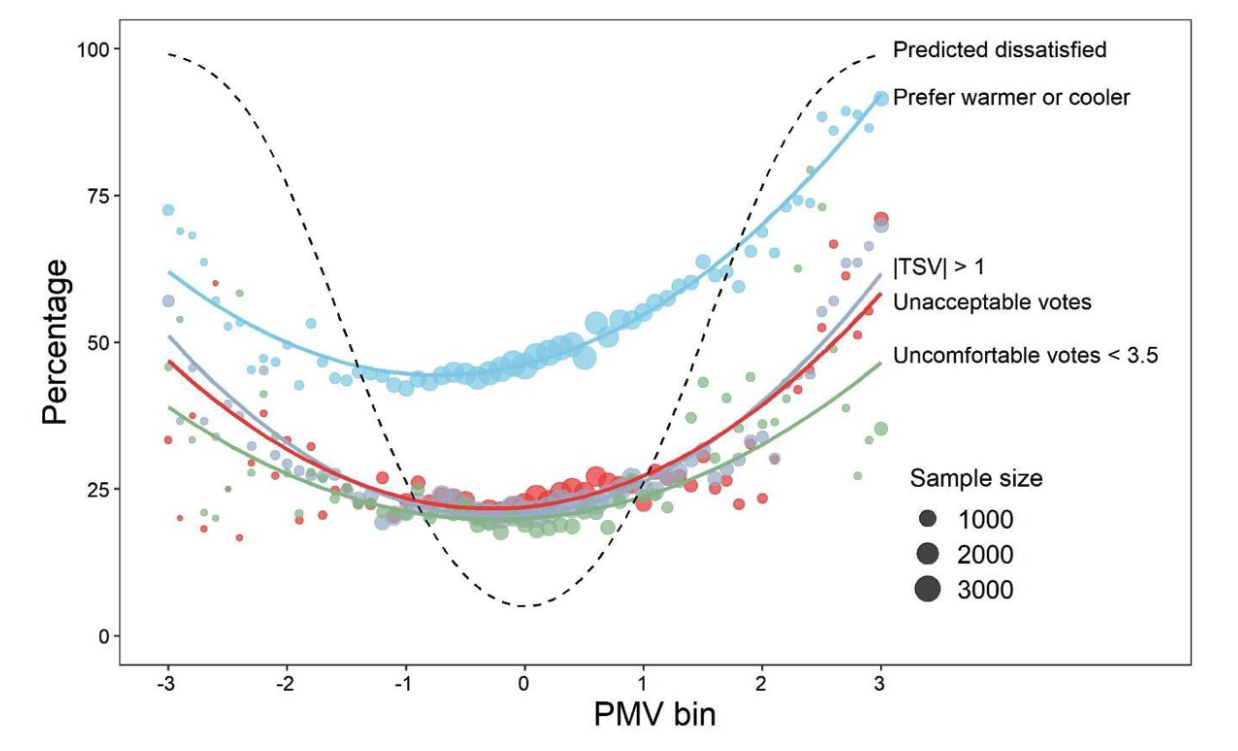
Figure 8.4: Observed percentage dissatisfied versus predicted percentage dissatisfied. Each dot represents the percentage dissatisfied and the lines are weighted by sample size. The X axis is the calculated PMV, divided into bins. The blue line indicates the preference for a warmer or cooler environment, the grey line is the absolute value for the TSV>1, the red line indicates that the thermal environment is rated as unacceptable and the green line are the “uncomfortable” votes, defined as <3.5 on the scale of 1 (uncomfortable) to 6 (comfortable). Source: Li et al., 2019.
The reason for the poor validity of the PMV/PPD model lies more in the PMV index than in the PPD index. Figure 8.5 shows that the relationship found in the field between observed thermal sensation (OTSbin) and observed percentage unacceptable (OPU) corresponds quite well to the PMV/PPD relationship developed in the climate chamber, but that the PMV, calculated from observed and measured variables, poorly predicts actual thermal acceptability (OPU). In particular, in the neutral and cold regions, there is no relationship between PMVbin and observed percentage dissatisfied. (Cheung, et al., 2019; Li et al., 2019).
As shown earlier in this book, it is difficult in practice to determine the PMV correctly, due to the large margins of uncertainty in the input variables of clothing insulation and, to a lesser extent, metabolism17. This confirms once again that a correlation found in climate chambers between a calculated thermal sensation and the degree of satisfaction cannot be applied one-to-one in real-life conditions and that narrower PMV categories around a neutral point do not increase satisfaction.
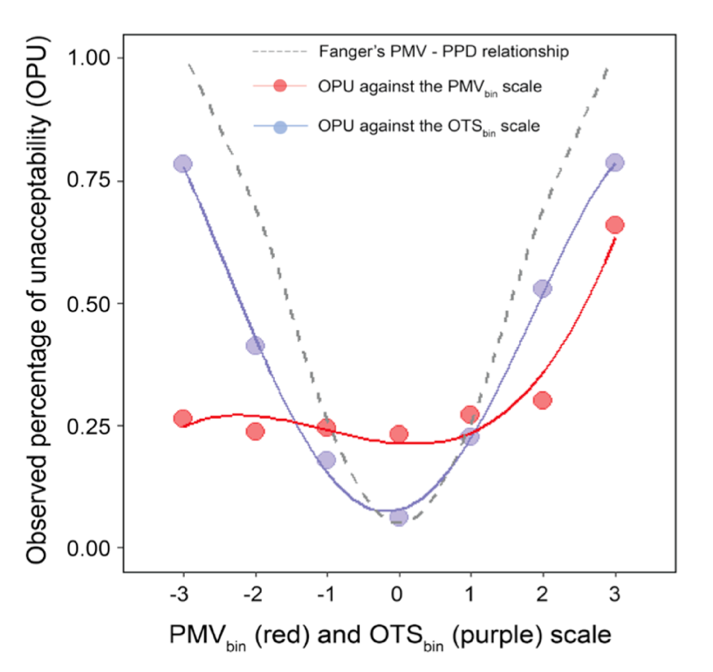
Figure 8.5: Relationship between the observed percentage of thermal acceptability (y-axis) and the observed and calculated PMV (x-axis): The red line shows the relationship between the Observed Percentage of Unacceptability (OPU) and the PMV (PMVbin), the blue line shows the relationship between the Observed Percentage of Unacceptability (OPU) and the observed thermal sensation (OTSbin). The dotted line is the theoretical relationship based on the PMV/PPD model. Source: Cheung et al., 2019.
8.4 Adaptive thermal comfort in different building types
Figure 8.6 shows the neutral temperatures from the new database projected onto the original RP-884/ASHRAE analysis (de Dear & Brager, 1998), as shown in Figure 6.3. Looking at the neutral temperatures of the naturally air-conditioned buildings (blue line), the slope is similar to the original database, but about 2°C higher than the RP-884/AHSRAE line and 1°C higher than the value from SCATs/EN16798-1. To investigate the cause of this, analyses were made of buildings in “Asia” (Middle East, India, South, Southeast and East Asia) and “West” (Europe, North America and Australia). Figure 8.7 shows that both indoor and outdoor temperatures are higher in the Asian data compared to the Western data.
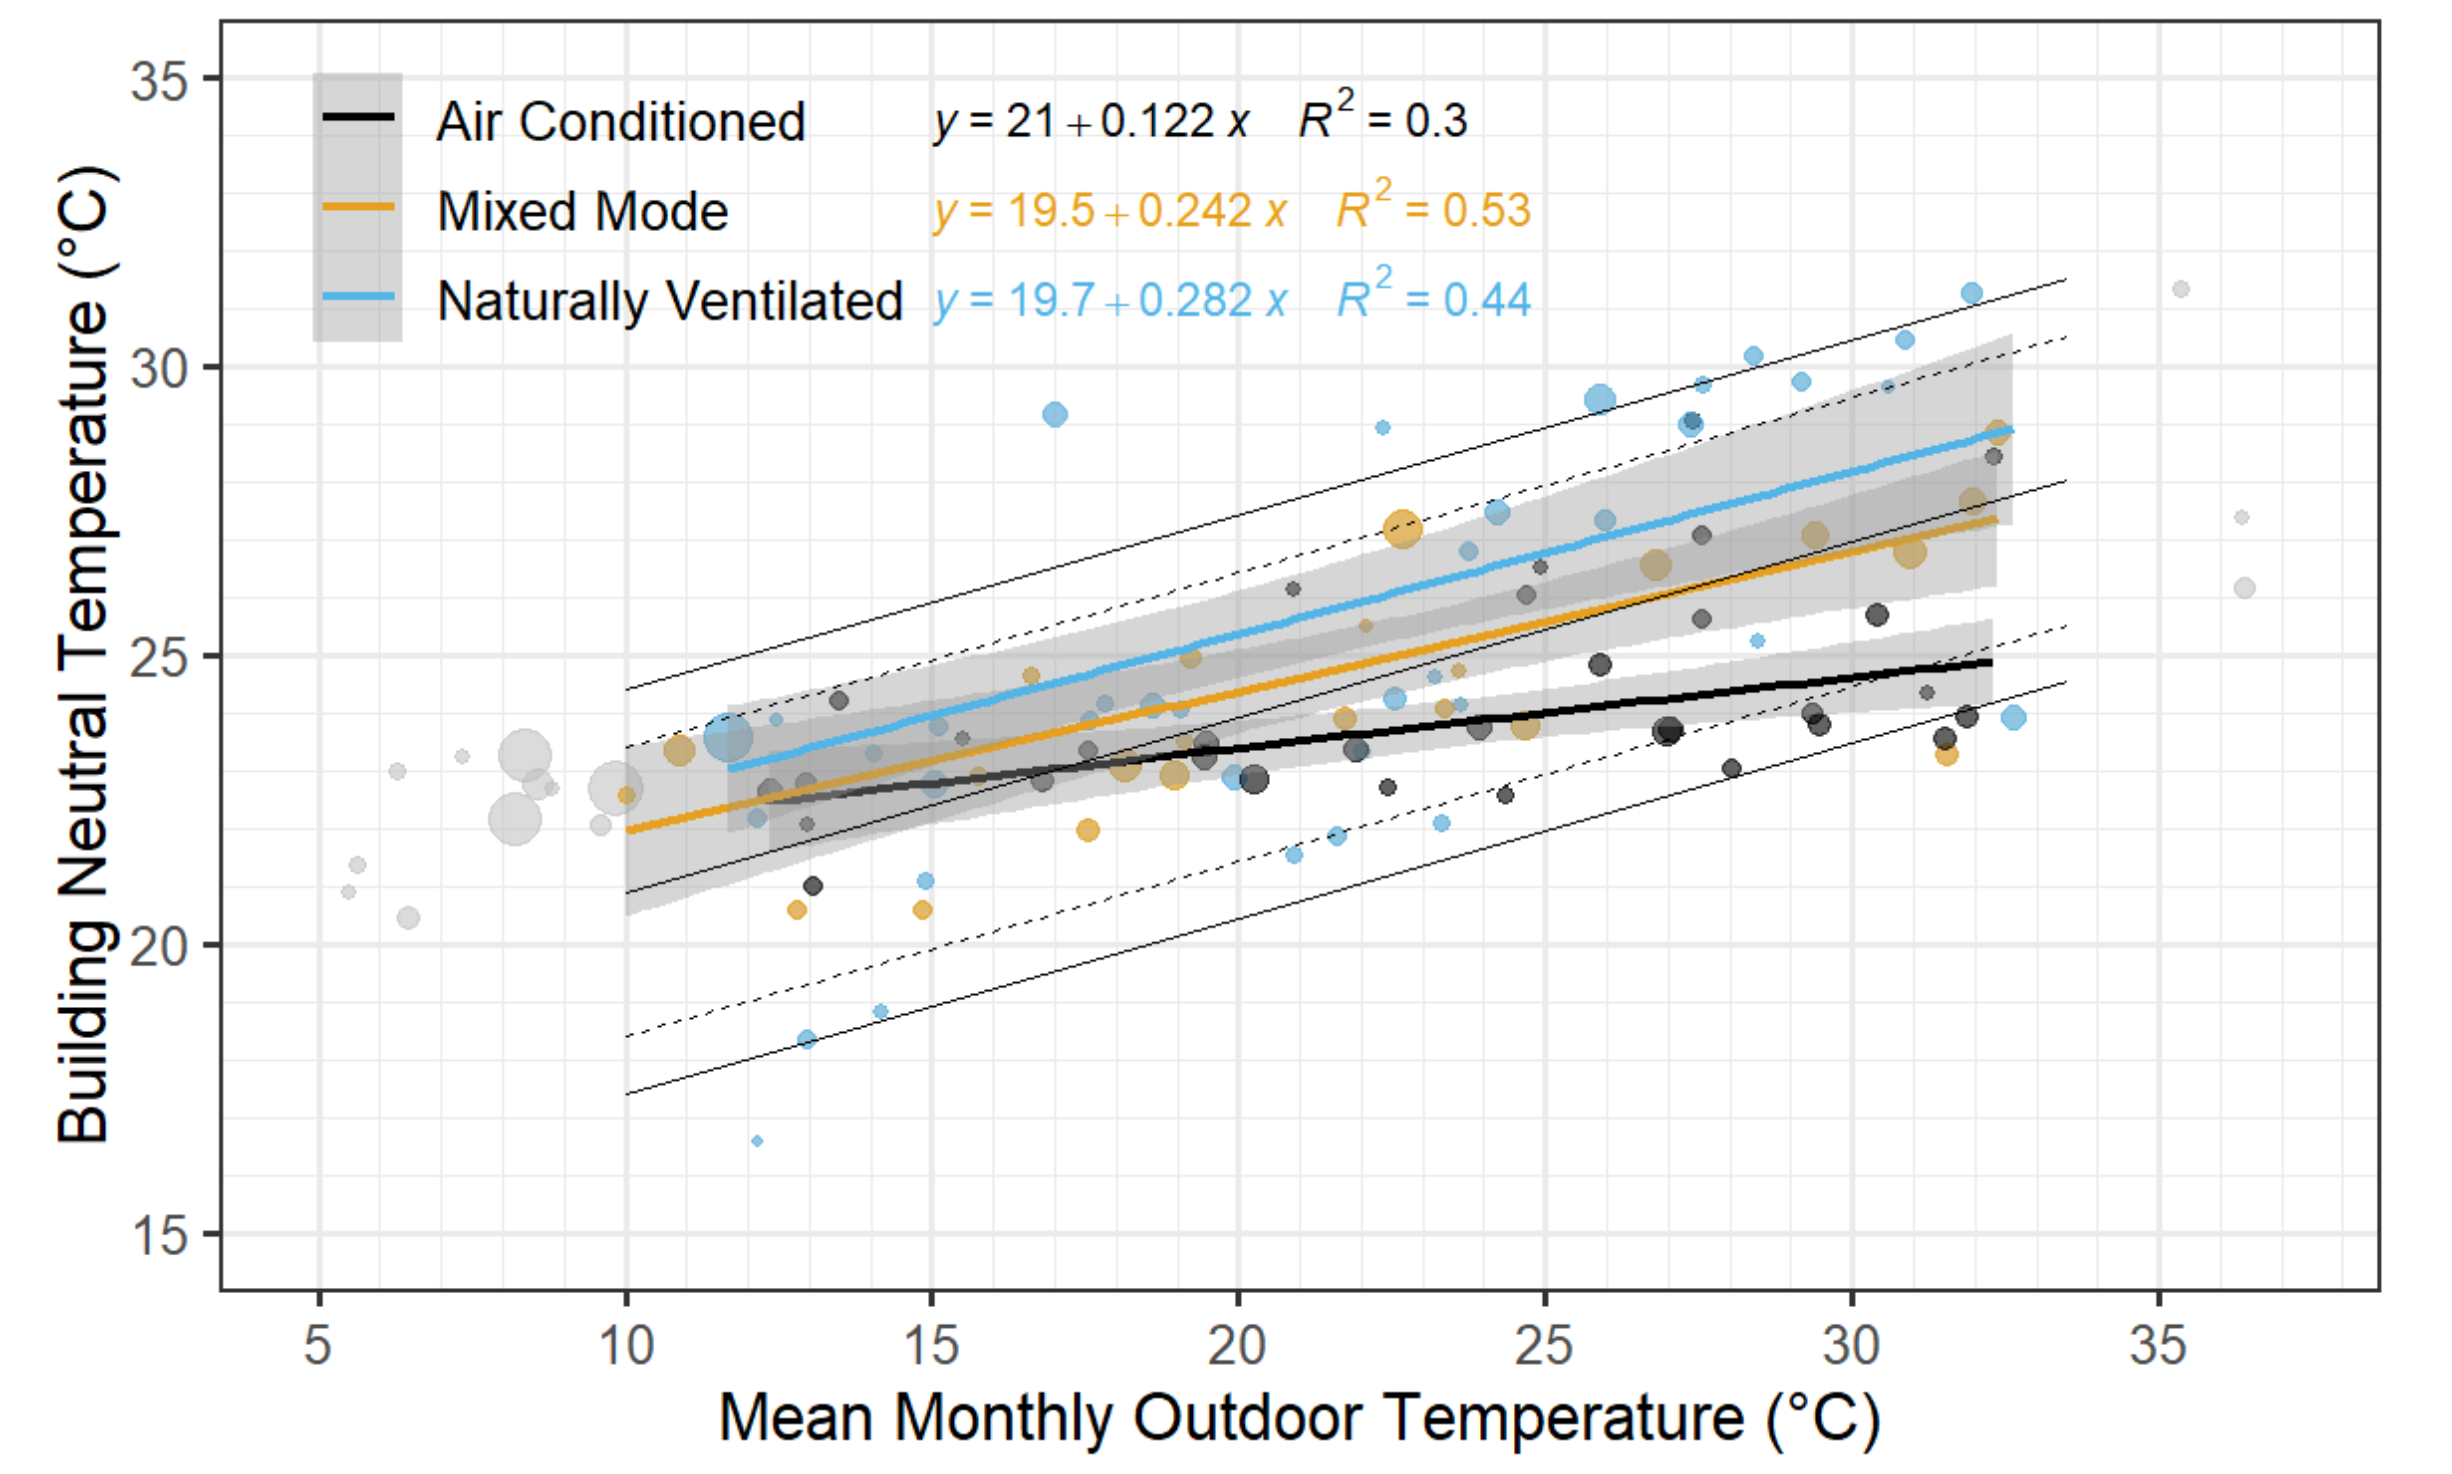
Figure 8.6: Neutral temperatures and mean monthly outdoor temperature during the survey in each building in the new database, projected onto the original RP-884 data (black solid and dotted lines), as shown in Figure 6.3. The air-conditioned buildings are shown in black, the mixed-mode buildings in yellow and the naturally ventilated buildings in blue. Each dot represents an individual building and the size of the dot indicates the weighting factor based on the sample size in that building. The grey areas indicate the 95% confidence intervals for each building type. Source: Parkinson, de Dear & Brager, 2020.
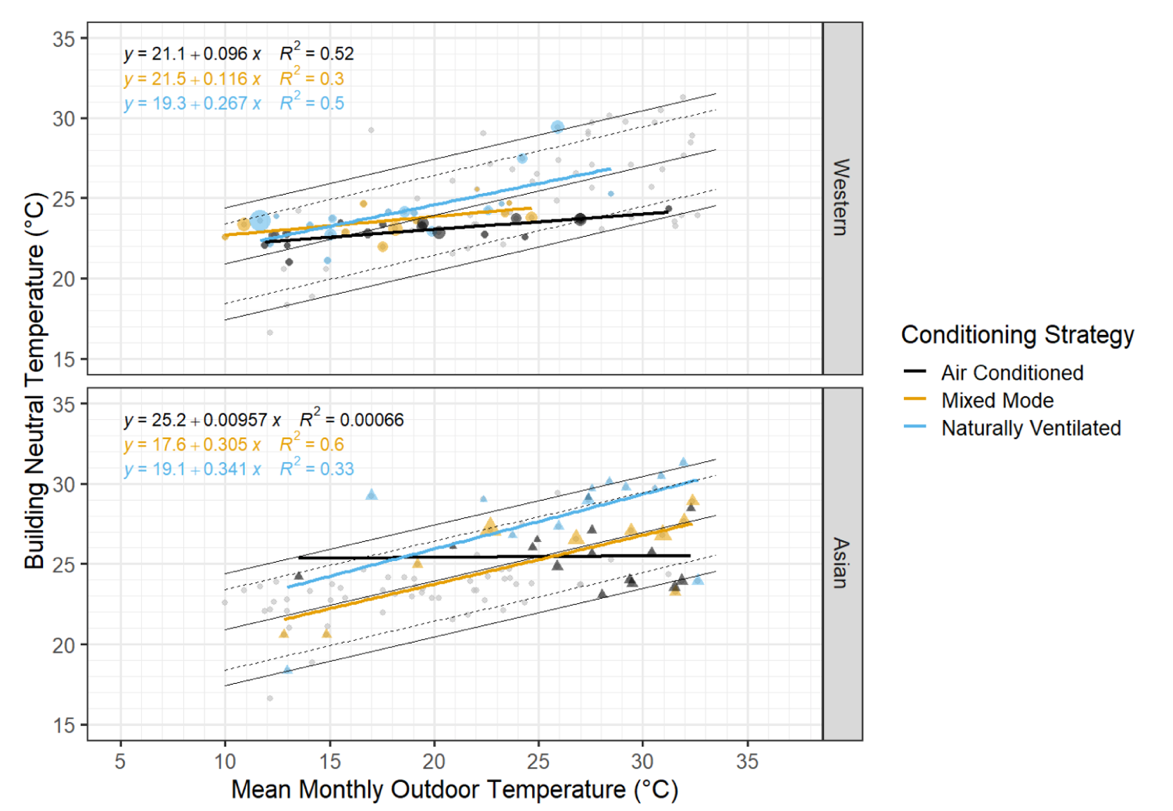
Figure 8.7: Neutral temperatures and mean monthly outdoor temperatures for Western and Asian countries. The air-conditioned buildings are shown in black, the mixed-mode buildings in yellow and the naturally ventilated buildings in blue. The grey dots are buildings from other regions for comparison. Source: Parkinson, Dear & Brager, 2020.
The neutral temperatures in both naturally ventilated and air-conditioned buildings in Asia are found to be slightly higher than in the Western data. The higher outdoor and indoor temperatures in Asian cities is the reason for the shift in neutral temperatures in Figure 8.7.
The original databases (RP-884 and SCATs) did not contain sufficient data from mixed-mode buildings to perform reliable analyses. The new database contains 25 mixed-mode buildings spread across different climate zones. Figure 8.6 shows that the neutral temperatures in the mixed-mode buildings (yellow lines) lie between those of natural and air-conditioned buildings, but are most similar to naturally ventilated buildings. In particular, the slope is equally steep. This supports the practical experience that well-designed and controlled mixed-mode buildings are perceived as naturally ventilated buildings at moderate temperatures and perceived as cooled buildings only at high temperatures. The low relationship between neutral temperatures and mean outdoor temperatures in air-conditioned buildings is present in all regions and cultures (black lines in Figure 8.6 and Figure 8.7).
The principles of adaptive comfort are usually associated with free-running, naturally ventilated buildings. The question arises to what extent adaptation also occurs in air-conditioned buildings. To this end, the neutral temperature for all building types is plotted against the mean indoor air temperature in Figure 8.8. The result is a much stronger relationship between the neutral temperature and the mean indoor air temperature than when the mean outdoor temperature is taken as the independent variable. The slope of the regression line is the same for all types of buildings and regions. The only difference is that both higher and lower air and neutral temperatures occur in mixed-mode and naturally ventilated buildings than in air-conditioned buildings, or in other words, that the indoor temperature in air-conditioned buildings falls within a narrower range than in other building types.
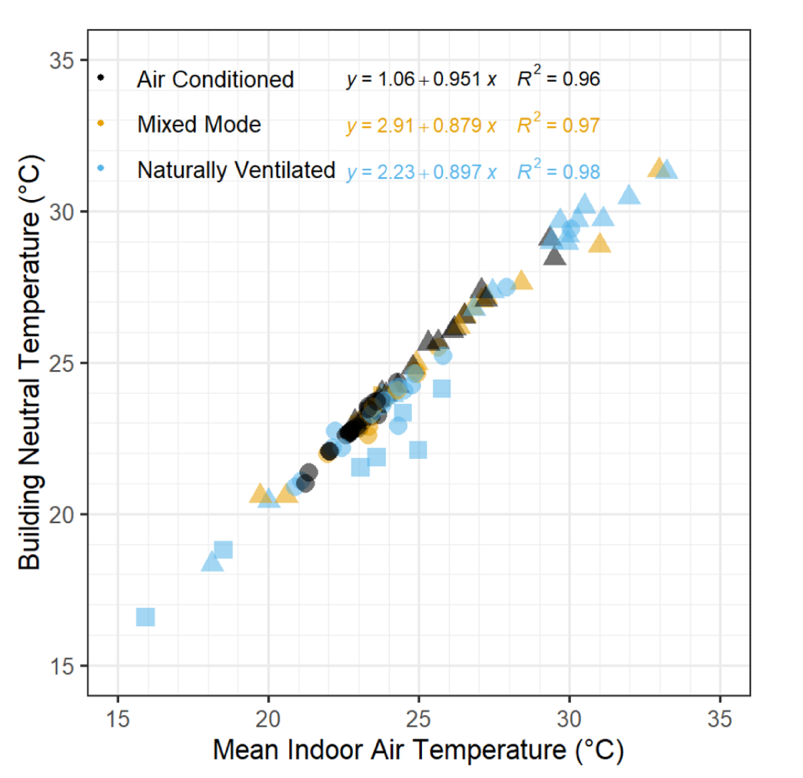
Figure 8.8: The neutral temperature for each building against the mean indoor air temperature for that building. The colours indicate the mode of climate control of the buildings. Sources: Parkinson, Dear & Brager, 2020.
Figure 8.8 shows that there is a strong relationship between what people experience as comfortable and the temperatures to which they are exposed indoors (see Section 2.4). This means that recent thermal exposure determines comfort temperatures, irrespective of the type of building and the method of conditioning. So, people in air-conditioned buildings also adapt, but to a temperature range that is significantly narrower, because it is controlled by the air-conditioning facilities. The reason why there is also a strong relationship between the comfort temperature and the outdoor temperature in naturally ventilated and mixed-mode buildings is because in those buildings there is a stronger relationship between the indoor and outdoor temperatures. Therefore, conventional adaptive models can predict comfort temperatures based on the outdoor temperature, but only sufficiently reliable when these are buildings where the indoor temperature varies with the outdoor temperature. This also means that air-conditioned buildings can be controlled over a wider temperature range than is currently the case, which can lead to greater comfort and lower energy consumption (Parkinson, de Dear & Brager, 2020). The main reason why this usually does not happen in practice, besides conservative design and air-conditioning practice, is the idea that a narrow temperature range would lead to higher productivity. That this is based on incorrect grounds is explained in Chapter 10.
8.5 Influence of humidity and other physical parameters on thermal comfort
In order to investigate the influence of parameters other than air temperature on thermal comfort, the new database was analysed, taking the SET (Standard Effective Temperature) instead of air temperature (Parkinson, de Dear & Brager, 2020). The SET is an index in which air temperature, air humidity, mean radiant temperature, air velocity, clothing insulation and metabolism are included (see Section 2.4 for an explanation of the SET). Figure 8.9 shows the relationship between the neutral SET temperatures and the Mean monthly outdoor temperature for the 3 different climate control methods.
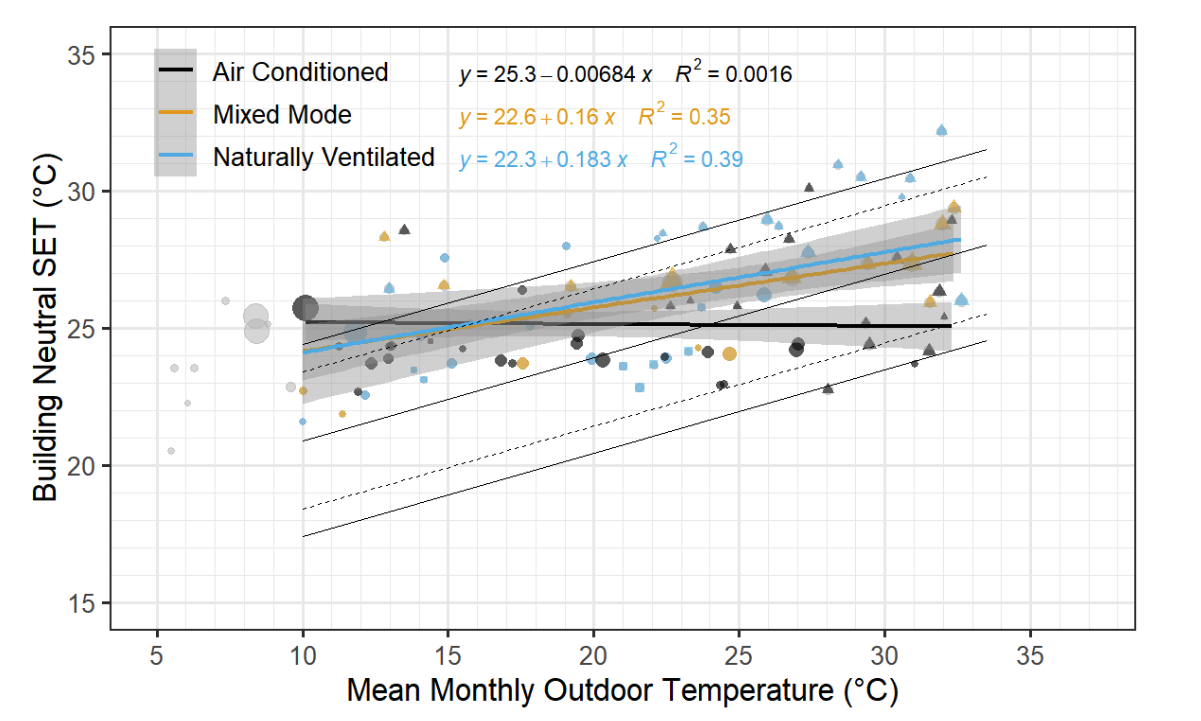
Figure 8.9: The same analysis as in Figure 8.6, but with the neutral SET temperature instead of the air temperature. Each point represents an individual building and the size of the point indicates the weighting factor, based on the sample size in that building. The grey areas indicate the 95% confidence interval. The grey dots are buildings that were outside the original comfort area and do not significantly affect the analysis. Source: Parkinson, de Dear & Brager, 2020.
The above shows that the slope of the regression line becomes one-third smaller compared to the slope in Figure 8.6. This means that about one third of the adaptive comfort is accounted for by the heat balance parameters of the SET index, namely air velocity, humidity, clothing insulation and metabolism. This also means that two thirds of the adaptive comfort consists of factors that are not based on the physical heat balance. These are factors such as adaptive opportunities, experiences and expectations of the thermal environment (psychological adaptation) and on physiological adjustments of the body.
In the adaptive thermal comfort model, the influence of humidity is not explicitly visible. Some researchers and consultants indicated that humidity is an important parameter and that it is a shortcoming of the adaptive comfort model that the influence of humidity is not explicitly expressed (e.g., Bronsema, Bokel & van der Spoel, 2013). One reason may be that designers of air conditioning systems use the Mollier or psychrometric diagram, which was developed over a century ago for the design of air conditioning systems, and gradually became used for comfort assessments in other types of buildings buildings as well (Kumar et al., 2016). Also, there is our own anecdotical and subjective experience that when air temperatures are high and humidity is also high, it can feel “stuffy” and “hot” and we often sweat more. Figure 8.10 shows combinations of the dry bulb temperature and humidity ratios for each building in the new database in the psychrometric diagram (Földváry Ličina et al., 2018). Most of these points fall within the range up to 27°C (horizontal axis, left of the vertical dotted line) and up to 0.015 kg/kg (vertical axis, below the horizontal dotted line). The buildings that fall outside these boundaries are those in Thailand, India and Singapore that have neutral temperatures of 27°C to 34°C and relative humidity between 60% and 80%. Field studies in parts of India, for example, show that people begin to notice the impact of humidity only at temperatures of around 32°C and higher (Kumar et al., 2016). This is consistent with the strong relationship between mean air temperatures and neutral temperatures in buildings that is independent of (high) humidity levels (Parkinson, de Dear & Brager, 2020).
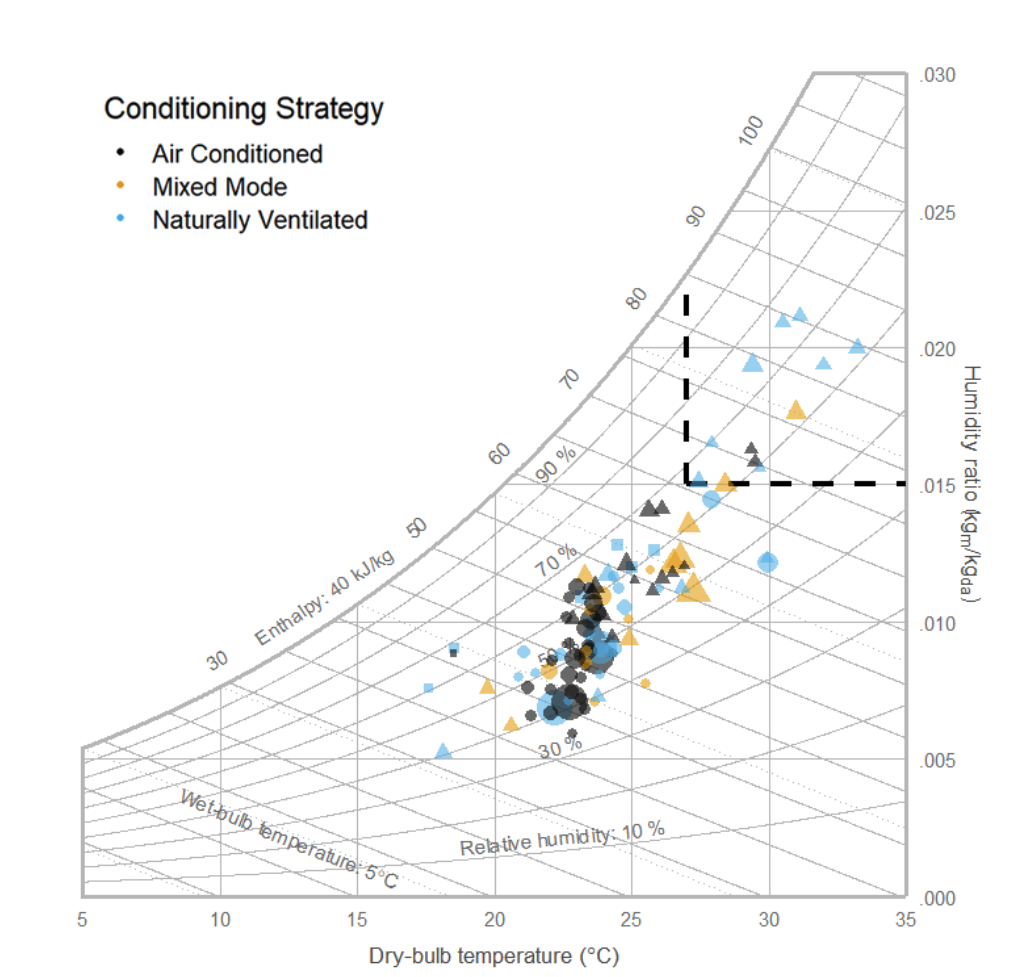
Figure 8.10: Psychrometric diagram showing the distribution of the combinations of mean indoor temperature and humidity for each building in the database. The majority of the (dry) air temperature and humidity ratios fall within the range of 20-27°C and 0.005- 0.015 kg/kg, delimited by the black dotted line. The colour of the dots indicates the method of air conditioning and the size of the dots indicates the size of the data set per building. The shape indicates the region: circle=Western; triangle=Asian; square=other. Source: Parkinson, de Dear & Brager, 2020.
To further investigate the influence of humidity in the adaptive comfort model, an advanced reanalysis of the ASHRAE RP-884 database was performed (Vellei et al., 2017). They also developed an alternative adaptive comfort model in which humidity was made explicit. To this end, humidity was classified into 3 categories: high: RH≥59%; medium: 37%<RV<59%; low: RV≤37%. The results show the following (Figure 8.11):
The comfort temperatures are generally higher and the slopes between the outdoor temperature and the comfort temperature are steeper than in the adaptive ASHRAE model;
Comfort temperatures are lower when humidity is high across the range of outdoor temperatures;
The high humidity gives the narrowest range of acceptable temperatures, while the ASHRAE range corresponds to the range at average humidity.
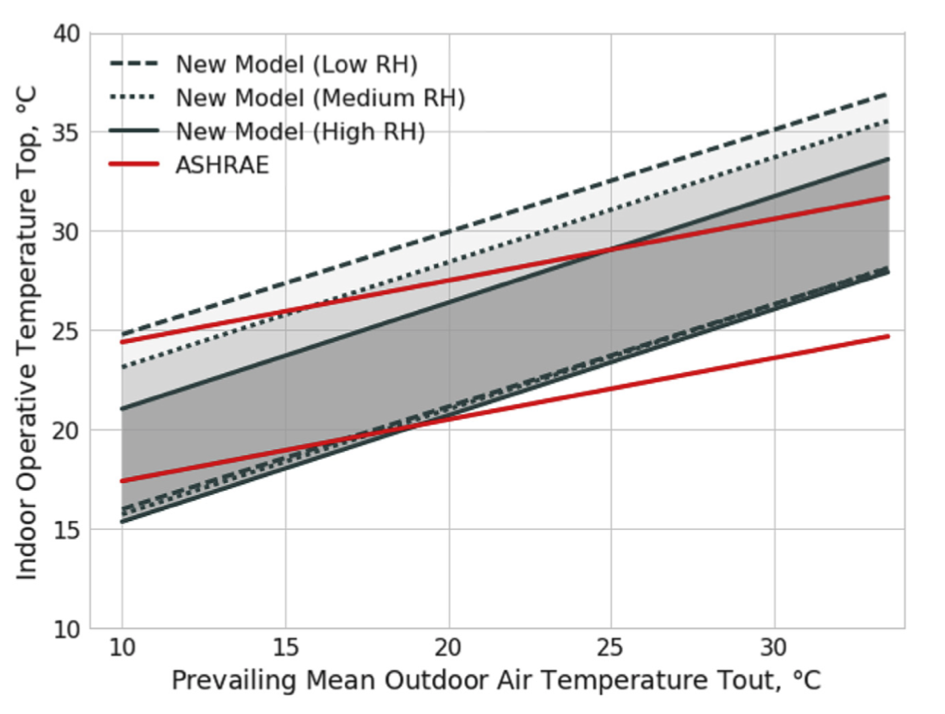
Figure 8.11: The adaptive bandwidth of the ASHRAE-55 standard (red lines) compared to the alternative adaptive model adjusted for different bandwidths of relative humidity. Source: Vellei et al., 2017.
Then, with the new model, temperature exceedance simulations were carried out in naturally ventilated buildings, situated in different climates. The new model gives significantly fewer overheating events than the current ASHRAE model and the differences are greatest in climates with low humidity. The warmer the climate, the lower the predicted overheating. This means that the new model offers more possibilities for the design of naturally ventilated buildings in climates with medium or low humidity compared to the ASHRAE model. The main reason why humidity is not (yet) included in the adaptive comfort model is that occupants of buildings in humid climates are well adapted to high humidity. This involves various forms of adaptation: physiological adaptation, through which people readily release heat into the environment by sweating; behavioural adaptation, through the use of fans, windows to be opened and cross-ventilation and lighter clothing; and psychological adaptation, through the expectation that humidity will be high for large parts of the year. The relatively large proportion of buildings in hot/humid climates in the ASHRAE RP-884 database contributed to an overestimation of the influence of relative humidity in the ASHRAE adaptive model in temperate and dry climates.
8.6 Practical implications of database II
Through the analyses of the ASHRAE Global Thermal Comfort Database II, knowledge of adaptive thermal comfort has continued to increase. A key conclusion is that the principles of adaptive thermal comfort apply, to some degree, to all buildings, regardless of how they are climatized, because adaptive processes and expectations are shaped by exposure to indoor and outdoor temperatures (Parkinson, de Dear & Brager, 2020).
Conventional adaptive comfort models predict comfort temperatures reasonably well, but only in free-running buildings. Since most people spend most of their time indoors, indoor temperatures will most strongly drive our experiences and expectations of the indoor climate. The reason that the adaptive comfort models show a limited relationship between outdoor temperatures and neutral temperatures in air-conditioned buildings is because of the small bandwidth in indoor temperatures in this type of building (Figure 8.8); there are too few data points in the cool and warm temperature regions due to the air-conditioning system controlling the temperature within narrow limits and because there are few temperature control opportunities available (Parkinson, de Dear & Brager, 2020; Schweiker & Wagner, 2016). The strong dependence of the neutral temperature on the mean indoor temperature is due to recent thermal exposure, independent of the climate system. This seems to contradict previous findings (de Dear, Brager & Cooper, 1997), but it is explainable, because all types of indoor climate (naturally ventilated, air-conditioned, mixed-mode) offer adaptive possibilities to a greater or lesser extent. The more adaptive opportunities, the greater the adaptation effect. It is a continuum of various adaptive opportunities and not a binary classification of two extreme conditions (Van der Linden et al., 2006). The new, more extensive database provides more knowledge to adjust and improve the first generation of adaptive guidelines.
In the future, a better distinction will have to be made between the various functional characteristics of the built environment, e.g. offices, schools and homes, because the adaptive potential here in particular can be (very) different. The analysis of the ASHRAE Global Thermal Comfort Database II by Li et al. (2019) shows, among other things, that the upper and lower limits of the ISO-7730 and EN 16798-1 standards for office buildings can be extended by around 2°C (Figure 8.12).
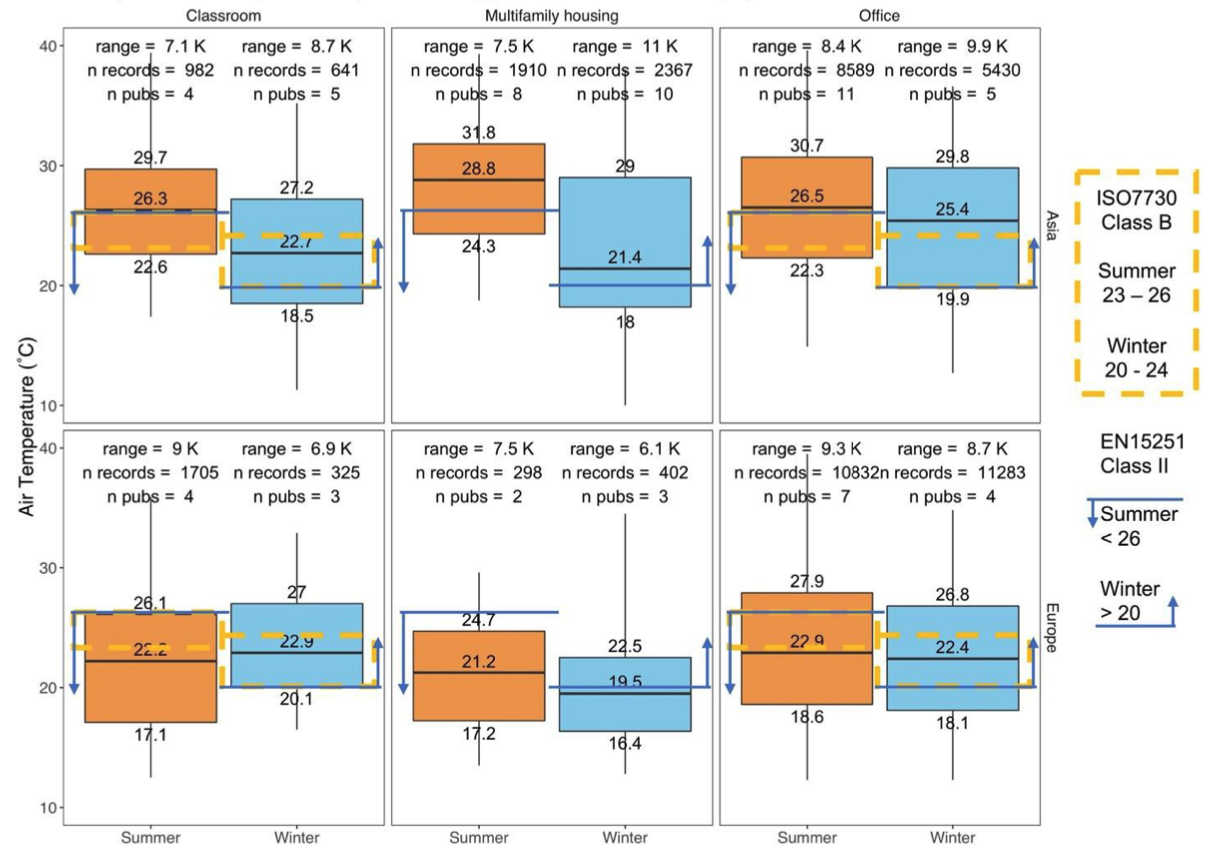
Figure 8.12: The boxes represent ranges of acceptable temperatures in database II for classrooms (left), homes (centre) and offices (right), for summer (red) and winter (blue). A differentiation is made for Asian (top) and European (bottom) data. The coloured bandwidths are compared with ISO7730 (yellow dotted line) and EN15251/EN16798 (blue arrows). Source: Li et al., 2019.
The ASHRAE Global Thermal Comfort Database II provides new insights for different building types:
Naturally conditioned buildings
The results of the new database show similar results compared to the original analysis. In the relationship between the outdoor temperature and the comfort temperature, the gradient of the regression line is similar to that in the existing standards. The comfort temperature thus increases by about one third of a degree for each degree of outdoor temperature. However, the Y-intercept in the new database is 1 degree higher in the Western countries and 2 degrees higher in Asia. This means that future standards will have to take into account the slightly changed values as a result of the expanded database. This will most likely be done in some regional classifications based on climate-specific and cultural data and not on country level (Parkinson, de Dear & Brager, 2020).
Mixed-mode buildings
Because the indoor climate in mixed-mode buildings can be controlled by both passive properties and natural ventilation as well as by mechanical cooling, it was unclear until now whether the adaptive guideline or the PMV model-based guidelines apply. The first ASHRAE database did not contain sufficient data to make statements about this. Therefore, in the ASHRAE-55 and EN15251/EN16798 the adaptive guidelines only apply to buildings without cooling. However, the ASHRAE database II contains considerably more data from mixed-mode buildings and shows that the comfort responses of the occupants of mixed-mode buildings are closer to those of naturally ventilated buildings than of air-conditioned buildings (Figure 8.6). When the SET index is used (Figure 8.9) instead of the air temperature, the mixed-mode buildings are even more similar to naturally ventilated buildings and it appears that the occupants of mixed-mode buildings have similar experiences and expectations as in naturally ventilated buildings. Cooling is then only used in very hot conditions (Deuble & de Dear, 2012; Rupp et al. 2018a; Parkinson, de Dear & Brager, 2020).
If mixed-mode buildings were assessed in the standards as "naturally ventilated" rather than "air-conditioned" it would have a substantially beneficial effect on both comfort and energy use. The indoor climate in mixed-mode buildings is characterised by three different control schemes:
The period that only natural conditioning/ventilation takes place;
The period that is exclusively mechanically cooled;
The transition period between the two.
This means that basically two approaches can be used to assess the indoor climate in mixed-mode buildings (Parkinson, 2020):
The adaptive model applies during the period when natural ventilation is in operation. When mechanical conditioning comes into effect and windows are (or must be) kept closed and cooling is provided to the top of the conventional PMV-based comfort zone for conditioned environments (27°C, 50% RH, 0.5clo), the PMV model will apply;
The adaptive model applies both in the period when natural ventilation is in use and when mechanical cooling is in operation. Mechanical cooling then ensures that the upper limit of the adaptive model is not exceeded. The recent analyses of ASHRAE database II, as discussed in this chapter, show that this approach provides a more pleasant and healthier indoor climate and consumes less energy and is therefore recommended (Parkinson, de Dear & Brager, 2020).
Airconditioned buildings
Although it is becoming increasingly clear that mixed-mode buildings should also be assessed using the adaptive model, air-conditioned buildings still appear to be designed and assessed using the PMV model. However, designers of fully air-conditioned buildings are better off using the principles of adaptive thermal comfort (Parkinson, de Dear & Brager, 2020). People adapt to the temperatures to which they are exposed and it is better for comfort and energy use to consider seasonal influences in control strategies and setpoint temperatures rather than designing a sort of climate chamber in a building. And as Chapter 10 shows, the arguments for promoting workers’ performance by controlling temperatures within a narrow temperature range are refuted. For air-conditioned buildings, the most appropriate neutral temperature could be derived from the graphical comfort zone for summertime (clothing insulation 0.5clo) on the psychrometric diagram of ASHRAE-55 (Figure 8.13). This corresponds to setpoints of 24°C-27°C at a relative humidity of 50% and an air velocity of up to 0.2m/s (Parkinson, de Dear & Brager, 2020).
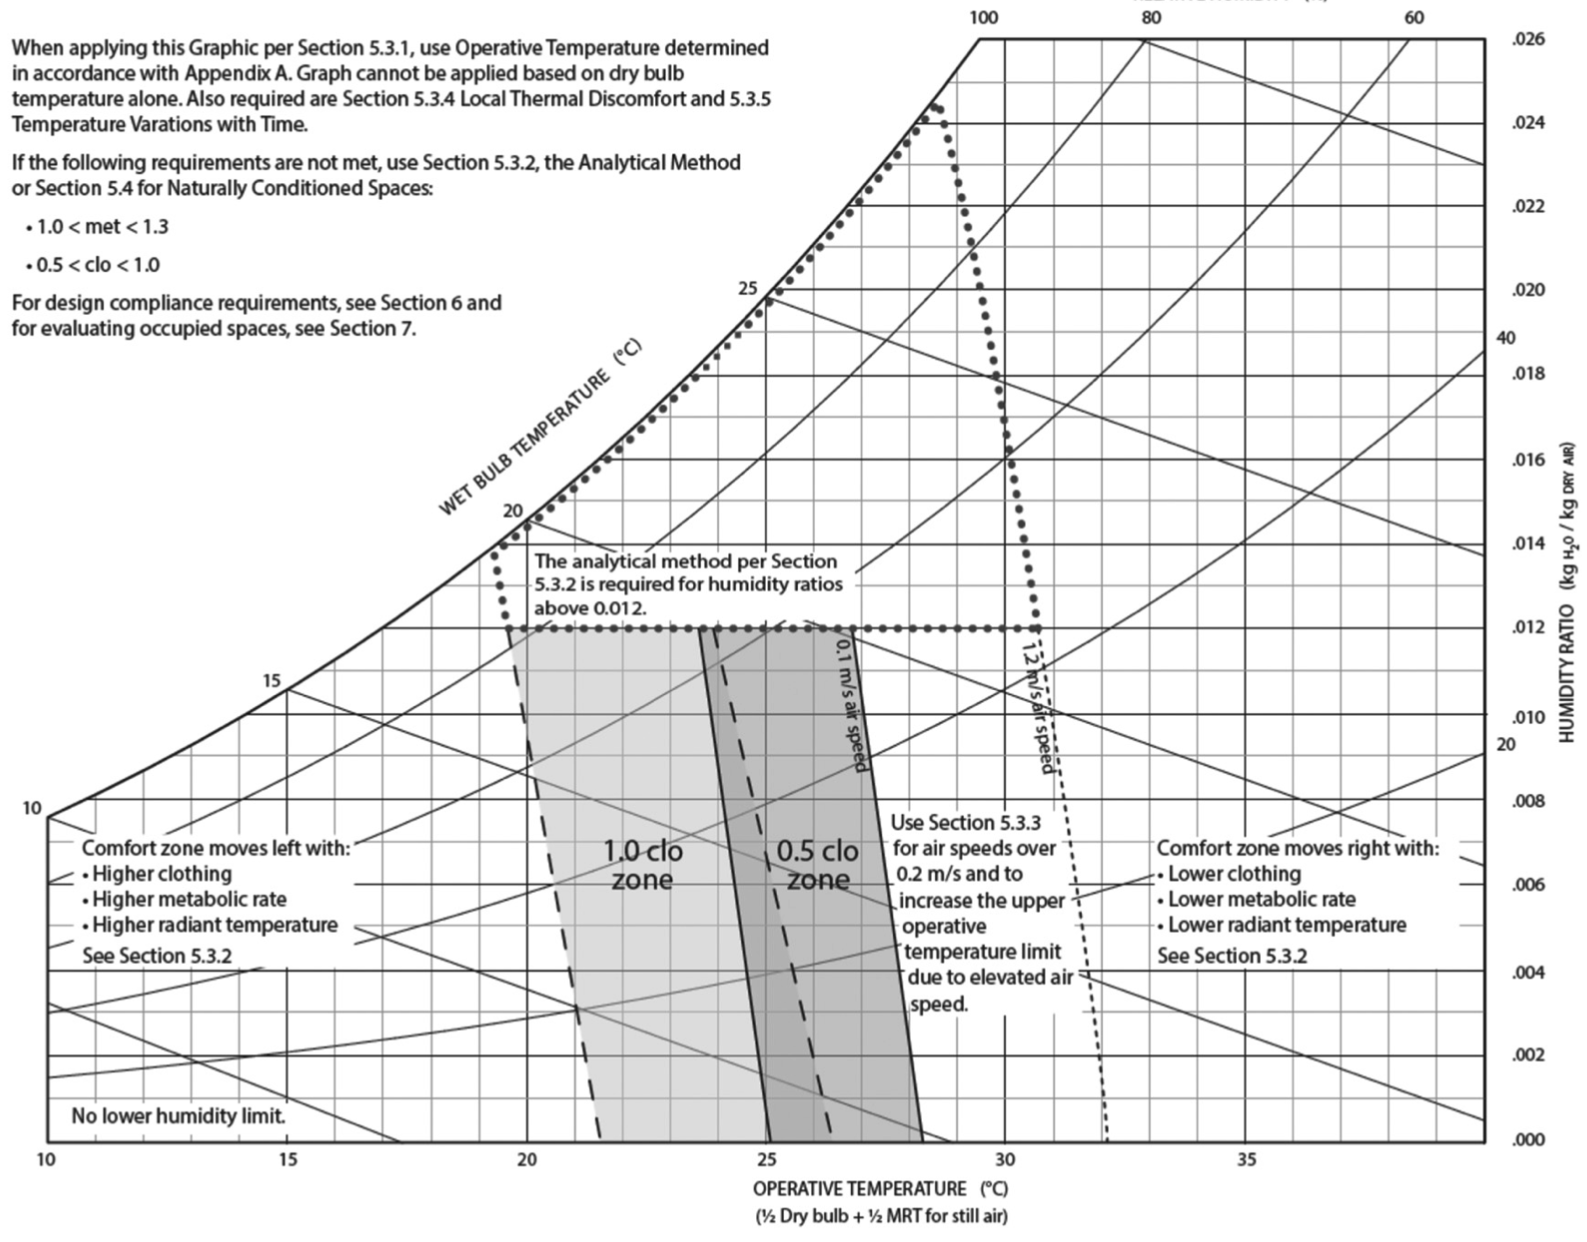
Figure 8.13: Graphical method for determining the thermal comfort zone for air-conditioned environments. Acceptable operative temperatures (to) and humidity for a metabolism of 1.0 to 1.3 with, clothing insulation of 0.5 to 1.0 clo and air velocities up to 0.2m/s. Source: ASHRAE-55, 2017.
However, occupants who have long been accustomed to a fixed temperature of around 22°C will have to get used to the fact that during summer time the indoor temperature is higher, sometimes by as much as 5°C. This can be achieved by gradually increasing the temperature over a period of several weeks in summertime, so that occupants can gradually adapt to the higher temperatures both behaviourally and psychologically.
15 A record is a row in the database consisting of a building occupant's responses to questions such as thermal sensation and comfort and associated measurement values such as indoor air temperature, air velocity, humidity, outdoor climate data and estimates of clothing insulation and metabolism and calculated thermal indices.
16 For the variable on the X axis of Figure 8.3(d), the PMV scores are divided into “bins”, which are carefully chosen categories when making histograms. All bins have the same range and all data should be included.
17 The information in Figure 8.4 and Figure 8.5 partly overlap and partly differ. Figure 8.4 examines the relationship of PMVbin with various occupant ratings, including the percentage of “unacceptable” votes. Figure 8.5 examines only the relationship of PMVbin with the observed percentage of unacceptable votes (OPU). In both figures, this corresponds to the red curve. At first glance, it seems that the curves in the two figures are rather different, but that is not so. The U-shaped curve in Figure 8.5 is an artefact of the way in which the curve was calculated, namely by means of a quadratic regression line. If we look at the red data points in Figure 8.4 in the cool area (PMVbin between -3 and -1) a large proportion of the data points are below the curve, which means that in this figure too, in the cool and neutral area, there is little or no relationship between PMVbin and the percentage of 'unacceptable votes'. The relationship in Figure 8.5 between percentage of unacceptable votes (OPU) and perceived thermal sensation OTSbin, the blue-grey curve, is not shown in Figure 8.4.