7. Indoor Climate Categories in Standards
7.1 Introduction
Both the standard based on the PMV model (Table 6.1 and Table 6.2) and the adaptive indoor climate standards (Figure 6.2 and Figure 6.3) give ranges within which a certain percentage of occupants find the temperature acceptable or comfortable. These ranges are divided into categories or classes (A, B, C or I, II, III, IV). A narrower range is referred to in the standards as a “higher level of expectation, ambition or quality”. This suggests that a narrower bandwidth will provide a better indoor climate in practice. In the certification method for a sustainably built environment BREEAM-NL (2014), for example, even explicit distinctions are made between a “good” and an “excellent” indoor climate, with the excellent indoor climate falling within a narrower bandwidth. It is appropriate to recall that the bandwidths represent a percentage of 80% or 90% acceptability that is an average of a database of a large number of buildings. A single building can have a different distribution within this bandwidth. In most cases, a narrower bandwidth does lead to a higher energy use, but whether it also leads to a more comfortable indoor climate in practice is questionable. Below, both empirical and theoretical arguments are given as to why indoor climate categories are problematic.
7.2 Empirical objections to indoor climate categories
In general, more energy is required to achieve a narrower temperature bandwidth. The question that arises here is therefore: does this extra amount of energy also lead to a more comfortable indoor climate in practice? This has been investigated in the databases of 45 office buildings around the world (RP-884) and the European database (SCATs) of 26 office buildings of various types in 5 European countries (Arens, 2010). Air temperature, radiant temperature, air velocity and humidity were measured in the buildings, and the clothing insulation and metabolism values were determined, so that PMV values could be calculated. In addition, the subjective comfort of the occupants was determined via questionnaires. The results are given in Table 7.1 and Table 7.2. In both tables, the three indoor climate categories according to the PMV/PPD model correspond to 90%, 80% and 70% acceptability, respectively.
Table 7.1: Comparison of calculated PMV ranges, A: 90%, B: 80% and C: 70% with actual acceptability (RP-884 database). Source: Arens et al., 2010.

Table 7.2: Comparison of calculated PMV ranges, A: 90%, B: 80% and C: 70% with actual acceptability (SCATs database). The percentages of building users voting “somewhat cool”, “neutral”, “somewhat warm” (third column) and “comfortable” (fourth column). Source: Arens et al., 2010.
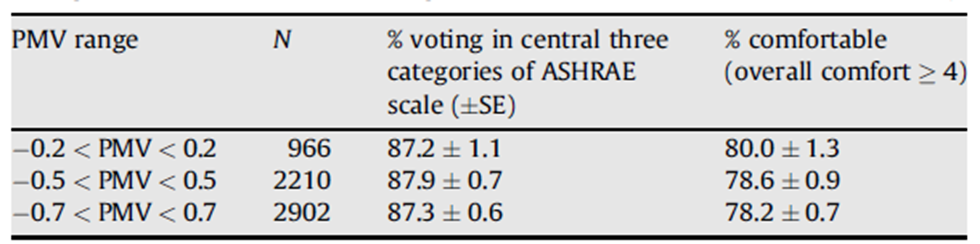
It is clear that a narrower range determined by measurements and calculated PMV/PPD ranges is not perceived by occupants as more comfortable or acceptable in real-life conditions. Sometimes there are no differences at all, in other cases a narrower PMV range leads to slightly more satisfaction, in yet other cases a narrower PMV range leads to less satisfaction. None of the differences are statistically significant. One reason is that the measurement uncertainties of the variables to calculate the PMV are as large as the differences between the ranges of the 3 categories (Alfano, et al., 2011). Thus, there is no empirical support for the idea that a higher climate class, with a narrower PMV or temperature limit on paper, also leads to more comfort or satisfaction in reality. This will be discussed in more detail in the following sections.
7.3 Theoretical objections to indoor climate categories
The adaptive standard EN 16798-1 defines the indoor climate categories as levels of “expectation”. The narrower the temperature bandwidth, the higher the level of expectation and the higher the indoor climate class, with the implication that there will also be more satisfied occupants. The question is whose and what level of expectation is involved. Given the role that the indoor climate standard plays in the design process, it could be about the level of expectation of the developer, the architect, the HVAC consultant or the management of the company housed in the building. At some time in the process a certain level of expectation is chosen. For example, the developer may choose an air-conditioned building in climate category A (or I), because he or she thinks it will get a higher building certification and will therefore be easier to rent out. Or the management of an organisation might choose to rent such a building to ensure that there are no or few complaints about the indoor climate from staff. However, it is most logical to assume that what is meant here is the users' expectation level. If users actually have different expectation levels, it is not obvious that these are defined in terms of the narrowness of the temperature bandwidth or in constancy of temperature. If we look only at the users, independent of the building, it is obvious that most users have roughly the same expectation level: a thermally comfortable environment for most of the time. If we include the type of building involved, there are differences in expectation levels. The study by Kim & de Dear (2012) discussed in Section 4.5 shows that occupants of air-conditioned buildings have a different expectation pattern of the thermal environment than occupants of naturally ventilated buildings.
For the occupants of air-conditioned buildings, thermal comfort is a basic factor. They expect it to meet high standards and, if the indoor climate does not meet these, they are more likely to be dissatisfied with the building as a whole. In addition, they expect a comfortable thermal environment and they expect to have to do little themselves, for example by changing their clothes or adjusting the temperature (if at all possible). For users of naturally ventilated buildings, thermal comfort is a bonus factor; if the indoor climate has shortcomings, this does not lead to dissatisfaction with the building as a whole, and if the indoor climate is acceptable, the users are additionally satisfied. They also feel jointly responsible for their own thermal comfort, because they can influence it through the use of openable windows and blinds and by adjusting their clothing insulation.
Chapters 1 and 4 have shown that the high expectations that clients or employers have of air-conditioned, category A buildings are often not met in practice, because the dependence on (complex) installations increases the risk of discomfort and physical symptoms, as this type of building has a low robustness (Chapter 5). Buildings with natural or hybrid ventilation with a high degree of control perform better and provide realistic user expectations.
The use of two types of standards alongside each other, namely a standard based on the PMV/PPD model and an adaptive standard, in combination with the current classification into climate categories, can lead to so-called perverse incentives. When, during the design process, a choice is made for the type of building and the envisaged indoor climate quality, and the client requires in any case a “good indoor climate” and therefore opts for category A, it may happen that the temperature simulations show that, given the physical design properties, the outdoor climate and the location, a building with adequate natural ventilation meets category B, but does not (just) meet category A. This can then be a reason for the client to decide to apply the PMV/PPD standard and therefore to choose a category A air-conditioned building, especially if the standard used gives the impression that adaptive comfort is only an alternative. There is a good chance that the air-conditioned category A building will in reality lead to more dissatisfaction about the indoor climate and more physical symptoms than the naturally ventilated category B building.
Another perverse incentive comes from the fact that, in addition to a “high level of expectation”, category A is also recommended for vulnerable groups, such as the sick, young children and the elderly. In many cases, this means that mechanical rather than building-physical and passive solutions will be used to comply with category A, which actually increases the risk of air quality complaints, possibly including headaches, fatigue, difficulty concentrating, irritation of the eyes, throat and nose, which is particularly undesirable for vulnerable groups. For these groups, natural air supply through the façade can be an interesting alternative to mechanical supply, because there may be a lower risk of contamination by pathogenic microorganisms than air supplied through filters, ventilation ducts and terminal units, which may not be properly maintained (Van den Engel & Kurvers, 2017). Moreover, different vulnerable groups cannot be treated in the same way. Chapter 9 describes that the elderly and children experience the thermal environment differently and that there are also individual differences within these groups. A normally good building can be assumed to have a satisfaction rate of 80%. Research shows not only that narrower temperature limits do not lead to more satisfaction, but also that a satisfaction rate higher than about 80% is not feasible in practice (Arens et al., 2010; Li et al., 2019).
7.4 Classification based on adaptive opportunities
Because of the problems with indoor climate categories, it has also been suggested to classify the indoor climate according to the adaptive possibilities for the users (Boerstra, 2010). One of the first attempts can be found in RP-884. There, the following adaptive possibilities are defined:
Openable Windows;
Exterior doors;
Interior doors;
Thermostats;
Curtains/light blinds;
Local heating appliances;
Local fans (ceiling or table-top).
Furthermore, for a subgroup of respondents whose overall score for the adaptive opportunities in their building and their score for individual adaptive opportunities was known, an index of personal adaptive opportunities was determined. From this data an index of Mean personal influence per building was derived. The relationship between this index and several measures of thermal perceptions within a building was then calculated, including the relationship with thermal satisfaction. None of these correlations is statistically significant. Apparently, simply determining whether an adaptive capability is present is not sufficient to predict thermal satisfaction.
A better approach is to base a personal or building control index not only on the presence of the adaptive opportunities, but also on their usability and effectiveness, based on assessments by actual occupants. A good example of this is given in Boerstra (2016). In questionnaires used to investigate the causes of complaints in specific office buildings, the questions asked included:
The presence of a temperature control system;
If present, the effectiveness of the temperature control;
The presence of a window that can be opened;
If present, the opportunity to adjust the openable window at ones own will.
Based on these questions, a control index can be formed that has a statistically significant relationship with, among others, a composite measure of comfort, as indicated by the occupants, and a measure of building-related physical symptoms, also as indicated by the occupants. In particular, the relationship between this control index and the number of building-related symptoms is strong. The explained variance (R2) is 42%, for the building comfort indices this is only 18% explained variance. Apparently, control opportunities are particularly important for physical health. A hypothetical explanation for this is proposed in Vroon et al. (1990): if there are stressful conditions, the person concerned can either choose external coping, in this case adapting the environment by means of control opportunities, or is forced to choose internal coping, accepting the circumstances, which in the long run can lead to an (over)load of the organism and thus to building-related health problems.
A study (Pigman, Brager & Zhang, 2018) in three mixed mode buildings examined the interrelationships between:
Accessibility to an adaptive opportunity;
Satisfaction with the opportunity to control the environment;
Perception: how much confidence do people have that using the control option will have the desired effect.
The results show that accessibility is not a good predictor of satisfaction, but trust, based on observation, that the use of the control opportunities has the desired effect, is. The following example shows that the presence of control opportunities does not in itself guarantee satisfaction. In one of the three studied buildings, the users were generally too cold. Moreover, of the three buildings, they were the most dissatisfied with the option of controlling the temperature themselves. The temperature in this building had a year-round set point of 20°C to 22°C, which is considerably too cold in summer. The occupants had several means of control at their disposal: sun shading, light shading and ceiling fans. None of these are suitable for reducing the complaints about too low a temperature. Pigman, Brager and Zhang conclude: This begins to suggest that simply having some form of environmental control isn’t necessarily helpful unless there is a clear match between the type of control and the likely source of thermal discomfort.” This is also a partial explanation why a standard composite index like the one in RP-884 does not work.
Discomfort and building-related health symptoms are not correlated with an index based on the presence of adaptive opportunities, but they are with an index based on the effectiveness or usability of adaptive opportunities as indicated by occupants themselves. This shows that there is still too little knowledge about the properties of adaptive opportunities that determine their effectiveness and usability. This concerns questions such as: which type of openable window is the most usable and does it depend on the type of building or room layout or on the type of HVAC system? Figure 7.1 shows reasons for satisfaction or dissatisfaction with openable windows, as reported by the occupants.
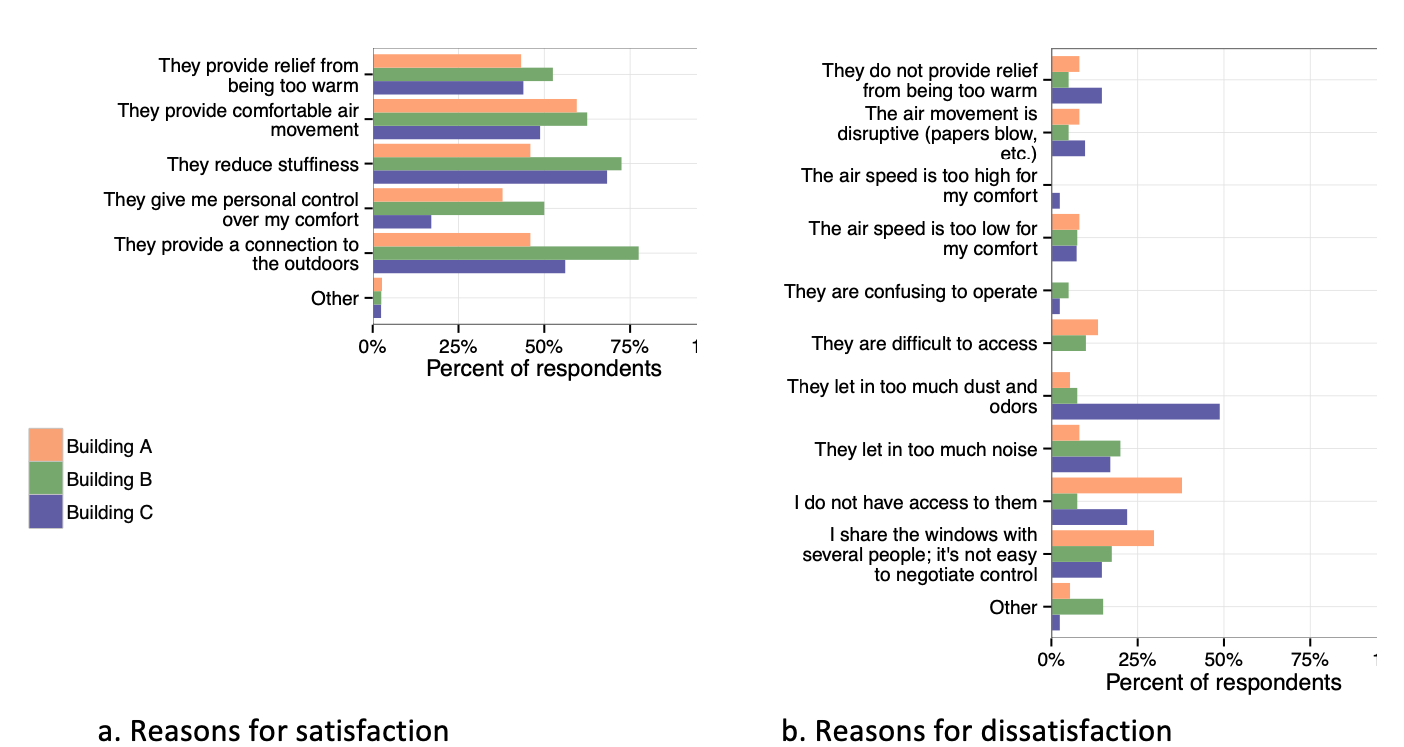
Figure 7.1: Reasons for satisfaction and dissatisfaction with openable windows. Source: Pigman, Brager and Zhang (2018).
One might ask if a building classification based on adaptive opportunities is a good alternative to existing classifications? It is worth recalling the importance of adaptive opportunities for comfort and health, for the following reasons:
The possibility to adapt the environment to one's own preferences;
The ability to (partially) compensate for any malfunctioning of building systems;
The possibility of positive alliesthesia;
Promotion of health because one can choose external coping instead of internal coping.
These reasons, especially taken together, are so important to demand that a “normally good” building should have as many adaptive opportunities as possible, as judged by its occupants to be effective. This is confirmed by the results of Boerstra (2016). When a classification based on adaptive opportunities is developed, the danger of perverse incentives arises here as well. In such a classification, certain adaptive opportunities will be reserved for extra “good” buildings, or category I or A buildings. “Normally good” or “appropriate” buildings will have do with fewer adaptive options, even though they are particularly important for comfort and health. Here, as with the classification based on temperature limits, the aim should be to define requirements for an “good or appropriate building” and requirements for an “extra good building” are undesirable.