2. The quest for comfortable temperatures
2.1 Introduction
What temperatures do people find pleasant or comfortable? The answer may surprise some: somewhere between 14°C and 32°C. It all depends on where you live, what clothes you wear, what you do, what you are used to and what you expect. Sometimes you might hear the phrase “set the thermostat to 22°C, that's a good temperature for most people”. This idea stems from research carried out in the 1960s and 1970s, mainly in climate chambers. The test subjects, mostly from Europe and the United States, wore the same clothes, performed the same tasks, spent only a few hours in the climate chamber, had no contact with the outside world, were often unable to set temperatures themselves and, in most cases, knew what the purpose of the research was. They were focused on answering questions about their sense of warmth, also known as thermal sensation. There was no influence of previous experiences, no work stress and there were no colleagues. In fact, the test subjects were in an abstraction of reality. The result was a fairly narrow bandwidth of about 3.5°C within which people would be “satisfied” (Fanger, 1970).
In contrast, studies of thermal comfort under everyday conditions show that comfortable temperatures can vary over a wide range. This depends not only on the physical environment, but also on personal, social, cultural, geographical and climatic factors. Moreover, individual preferences do not appear to be stable, but are subject to change. This means that thermal comfort cannot be achieved in practice by offering a constant temperature to a group of people in an open plan office, for example, even if it falls within the narrow bandwidth of around 22°C.
Thermal comfort has been studied since the 1930s in both climate chambers and in real environments (field studies). The results of climate chamber research became popular in the 1970s and, until fairly recently, formed the basis of standards and guidelines that were leading in how buildings were designed and air-conditioned. From around 1990, field research gained momentum, partly because measuring equipment became smaller, smarter and cheaper. The results led to the start of the revision of standards and guidelines.
2.2 Human thermoregulation and heat transport
The physiological and physical aspects of human thermoregulation are outlined below, followed by a discussion of analytical climate chamber models.
Heat production
The human body can only function properly (chemical processes such as enzyme, protein, hormone production) if the core of the body (the vital organs) is kept within narrow temperature limits. During metabolism, food is burned with the help of oxygen from respiration and converted into energy. Under normal circumstances, most of this energy consists of heat; a relatively small part is converted into mechanical energy (physical exercise). Metabolism (M) is expressed in W/m2 or in Met (1 Met is 58.16 W/m2ADu, equivalent to a person sitting down). The m2ADu is the body surface area, determined by the Dubois formula and depends on body height and build. Usually 1.8 m2 is used, which means that an average person produces about 110 Watt of heat at rest. When a person is performing physical work (W in W/m2), energy is required. This mechanical work is obtained from the metabolic energy production (M in W/m2). The amount of energy that remains (the major part) is released as heat (H in W/m2):
H = M - W
With this mechanical work, the mechanical efficiency η is relevant:
η = W / M
Mechanical power therefore represents a percentage of the total metabolic energy. η is close to 0 for most exertion and rises slowly to 0.1 for activity (physical work) and around 0.2 for very intensive activity (e.g., climbing a mountain). The metabolic rate is determined by measuring oxygen consumption, recording heart rate or using extensive tables. Measurement is the most accurate, but often difficult to realise in a working environment. Determining metabolism using tables is simple but inaccurate and requires considerable experience. The metabolism varies over time and is strongly influenced by breaks, eating and drinking, mental effort and stress.
Heat transport
A naked body at rest will be thermally neutral at an ambient temperature of about 28°C (Mcintyre, 1980). In other words, the body is in thermal equilibrium, the skin temperature is experienced as pleasant (approximately 34°C) and there is no sweat production. Heat is transported from the core of the body to the skin surface by means of blood flow and, to a lesser extent, by conduction in the tissues. At the skin surface, the heat is then transferred to the environment. When the body is in danger of losing too much heat, for example in a cold environment and/or when heat production is low, vasoconstriction occurs, which means that less blood flows to the skin surface and the skin temperature drops. When the body is in danger of becoming too warm, in a warm environment and/or with a high metabolism, vasodilation occurs, causing the skin temperature to increase and more heat to be transferred to the environment. When the body, due to exertion or a high ambient temperature, has to give up more heat, sweating occurs after some delay and the pulse and respiratory rate increase. After repeated exposure to higher temperatures (from a few days to a few weeks), acclimatisation occurs: sweating starts earlier and in greater amounts, which lowers the skin temperature and reduces the heart and respiratory rate.
Thermoregulation
The main inputs for the thermoregulatory system are skin temperature and core temperature. The control centre is located in the hypothalamus in the brain, the anterior part regulates when the body gets too warm, the posterior part controls when there is a threat of cooling down. The anterior hypothalamus functions as a sensor and regulator which means that when the temperature of the anterior hypothalamus rises above its set point, nerve impulses are emitted to stimulate vasodilation and sweating. When the body is unable to dissipate sufficient heat despite maximum sweating, thermoregulation becomes disturbed and the core temperature rises, putting the body's functions at risk. The posterior hypothalamus defends the body against cooling down. It does not “feel” temperature itself but receives data from skin sensors and then activates vasoconstriction and shivering.
2.3 Physical mechanisms
In the previous section we saw that the body tries to keep its (core) temperature constant by controlling the heat flow to the skin. The skin surface in turn exchanges heat with the environment by means of radiation, convection, evaporation and conduction (Figure 2.1). Heat exchange with the environment through conduction is usually negligible. It occurs in practice only where the skin comes into contact with materials (bare feet, hands, forearms). Skin temperature is influenced by a combination of the abovementioned physical aspects. The heat exchange is significantly influenced by the thermal insulation and water vapour permeability of the clothing.
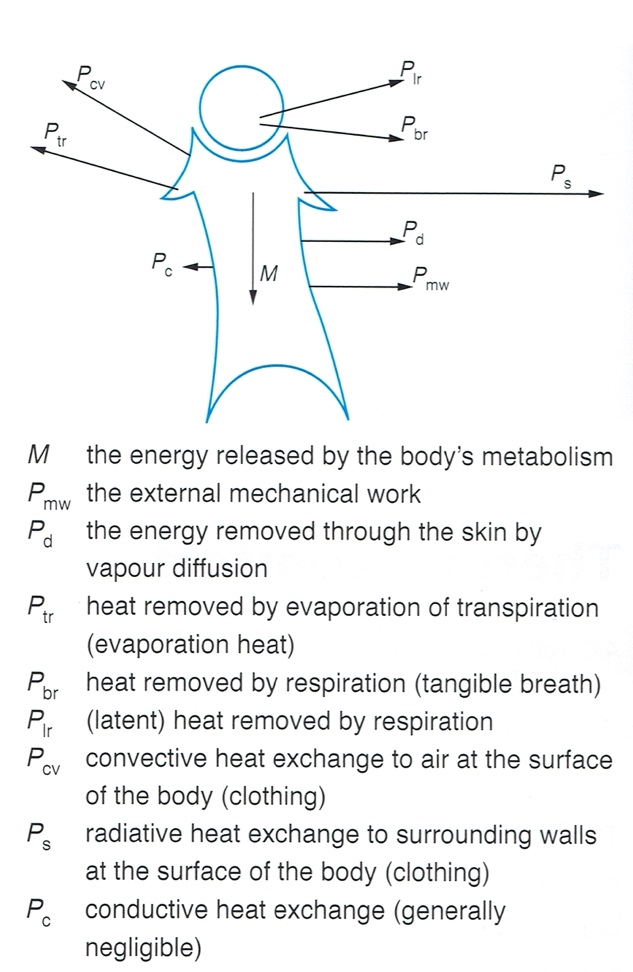
Figure 2.1: Energy exchange of the human body with the environment. Source: Van der Linden, 2016.
Radiation
By means of thermal radiation, the body exchanges heat with all the objects surrounding it, for example walls, windows, the sun and heating radiators.
The degree of radiation depends on:
The temperature difference of the heat exchanging surfaces;
The distance between the exchanging surfaces and the angle at which they face each other;
The emission coefficient of the radiating surface.
Radiation is expressed in terms of the mean radiant temperature tmrt (°C), which can be defined as: the temperature of a uniform environment at which a person would exchange the same amount of heat by radiation as in the actual environment.
Convection
Usually the skin temperature (or in practice the surface temperature of the clothing) of a person is higher than the air temperature. The layer of air surrounding a person is warmed up and blown away by the air movement present (draught, wind) and replaced by cooler air. This is called forced convection. If there is no air movement (air speed v ≤ 0.10m/s) the warmed-up air will rise due to its lower specific weight and be replaced by cooler air. This is called free convection (see also Section 4.7).
Evaporation
The production and evaporation of sweat is the most effective heat dissipation mechanism, especially in warm environments. At ambient temperatures higher than the mean skin temperature, humans rely primarily on sweat evaporation to dissipate heat. Two “steps” can be distinguished here: the physiological sweat regulation mechanism and the physical evaporation process from the skin into the environment. When there is sweat on the skin, evaporation requires heat, which is extracted from the skin and therefore cools it. Dripping sweat therefore has no cooling effect. In addition to evaporation, water vapour diffuses through the skin. In contrast to sweating, the degree of diffusion depends mainly on the physical environment. Finally, heat loss occurs through respiration of air heated and humidified in the lungs. Sensible heat loss is heat released by airflow, radiation or conduction. Latent heat loss is body cooling by evaporation of water through respiration and sweating.
Clothing
Clothing influences both heat emission through thermal insulation and moisture evaporation from the body and consequently skin temperature and skin moisture, which to a large extent determine a person's thermal sensation. Therefore, by varying the clothing, people can influence their thermal comfort within wide limits. Clothing influences evaporation in two ways. It is an additional resistance to water vapour diffusion and if the clothing absorbs sweat, less sweat evaporates onto the skin and also extracts less latent heat from the skin, thus partially negating the cooling effect. This is why, for example, sportswear is made of vapour-permeable fabrics that absorb little moisture. The thermal resistance Iclo is expressed in clo units. One clo is the thermal insulation of clothing to keep a seated person thermally neutral at a temperature of 21°C and equals 0.155m2K/W.
2.4 Research in climate chambers
The advantage of climate chambers is that the physical conditions can be closely monitored and extensive measurements on humans can be taken. This makes it possible to study in detail the physiological responses, such as skin blood flow, vasodilation and vasoconstriction, which regulate the transport of heat between the body and the environment. By also recording the subjective feeling of heat and cold during the experiments, insight is gained into how people experience a particular thermal environment. The Danish researcher P.O. Fanger became widely known for his research into thermal comfort in climate chambers. He analysed the data of 1296 students, 128 in Denmark, and 720 and 448 respectively from previous research in the United States (Fanger, 1970). The model he developed is based on the heat equilibrium model and thermoregulation of the human body. Based on this thermophysiological model, Fanger developed an equation that predicts the mean thermal sensation expressed on the ASHRAE thermal sensation scale (Table 2.1). He called this the PMV (Predicted Mean Vote). Using this equation, the PMV, i.e., the thermal sensation of an average person, can be calculated on the basis of air temperature, mean radiant temperature, air speed, humidity, metabolism and clothing insulation.
Various computer programs can be found online with which the PMV can be calculated, for example http://comfort.cbe.berkeley.edu/. With such a tool, the various parameters can be varied and the sensitivity of the PMV value to those parameters can be studied. For example, the PMV increases (the body warms up) when the air temperature, the radiant temperature, the clothing insulation or the metabolism increases or the air velocity decreases. Conversely, the PMV becomes lower at lower air and radiant temperature, if air velocity increases (air flow cools the body), clothing insulation decreases or metabolism decreases (less physical activity produces less body heat). The influence of humidity is usually limited in indoor environments (Section 8.5) and only becomes noticeable at higher temperatures and higher humidity when the body starts to produce sweat that evaporates from the skin and, due to the high humidity, is more difficult to evaporate, making it harder for the skin to cool.
Table 2.1: The ASHRAE scale for assessing thermal sensation. Source: ASHRAE, 2015.
| Thermal sensation | Vote |
| +3 | Hot |
| +2 | Warm |
| +1 | Slightly warm |
| 0 | Neutral |
| -1 | Slightly cool |
| -2 | Cool |
| -3 | Cold |
By assuming that the subjects who voted -2 (cool), -3 (cold), +2 (warm) and +3 (hot) were “dissatisfied”, the theoretical percentage of dissatisfied could be calculated, the PPD (Predicted Percentage of Dissatisfied), see Figure 2.2.
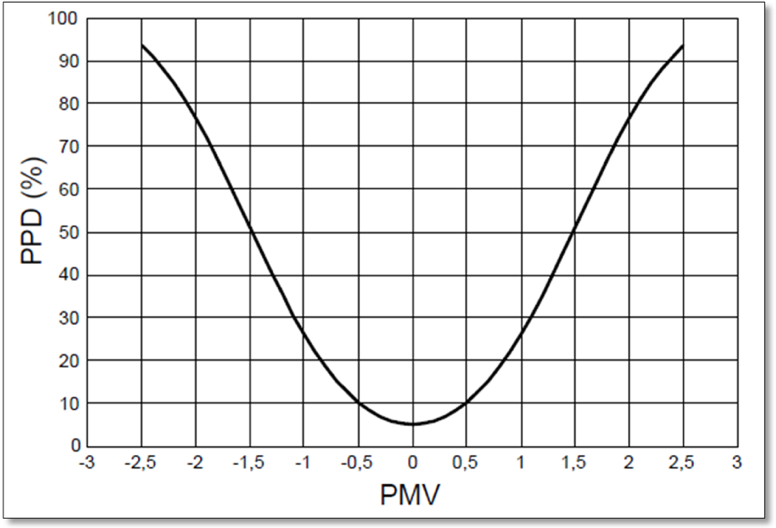
Figure 2.2: Relationship between the PMV index and the PPD index in climate chambers. The percentage of dissatisfied people is lowest at a PMV of 0. This percentage increases with a higher or lower PMV. Source: Fanger, 1970.
Another widely used index to quantify thermal comfort, and partly comparable with the PMV, is the Standard Effective Temperature (SET). This index is based on the more detailed Pierce Two-Node Model2 (Gagge et al, 1970, 1986). This model focuses more on thermoregulation and comfort under warm conditions where people sweat. The SET is defined as “an imaginary thermally uniform environment with an air temperature equal to the mean radiant temperature, a relative humidity of 50% and an air speed of less than 0.1 m/s, in which the total heat loss from the skin of an imaginary person with an activity level of 1 Met and a clothing insulation of 0.6 clo is the same as that of a person in a real environment with real clothing and activity level”. The SET is thus a function of activity level and clothing as well as the physical variables of the environment. So a person sitting down in light clothing at a low airspeed and an air temperature of 24°C at 50% humidity has a SET of 24°C. If this person were to take off his clothes, the SET would be 20°C, because the skin temperature is now the same as that of a lightly dressed person in a real environment of 20°C (McIntyre, 1980). The SET is used in psychrometric diagrams instead of the air temperature in order to show the effect of the other physical variables that influence comfort (further information on psychrometric diagrams is given in Section 8.4). In addition to Fanger's comfort equation and the Pierce Two-Node Model, there are several other, more detailed, models for research on human thermoregulation (Huizenga, Hui & Arens, 2001; Kingma et al., 2012; Schweiker et al., 2018).
It is interesting to compare the PMV and SET. The ASHRAE RP-884 database (see Section 2.5 and Chapter 3) makes this possible, as both use all six main variables to calculate the index (Humphreys, Nicol & Roaf, 2016). Each row in the database gave a calculated value of PMV and of SET based on the same measured environmental data and therefore eliminating the effect of measurement error. Figure 2.3 shows the scatter diagram of PMV and SET.
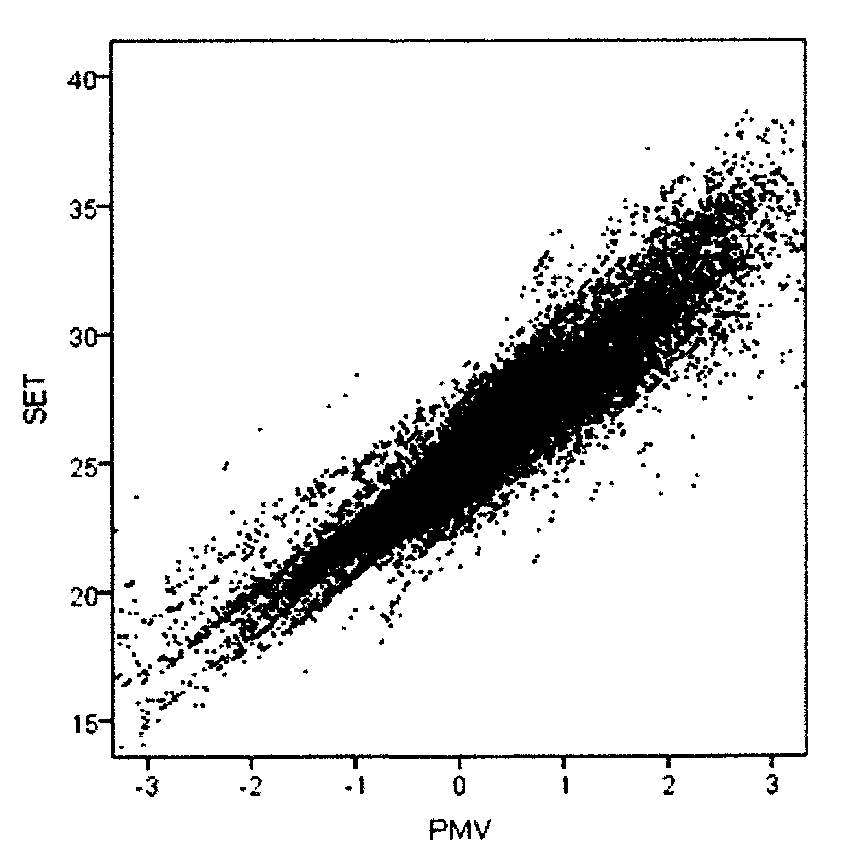
Figure 2.3: Comparison of SET and PMV in the ASRAE RP-884 database. Source: Humphreys, Nicol & Roaf, 2016.
If the indices are consistent with each other, there would be no scatter, only a single line or curve connecting the two. However, a value of PMV does not give an exact corresponding value for SET. The difference is significant, up to a few degrees. The PMV or SET, or both, seem to contain significant errors, and their practical applicability is therefore questionable, as we will elaborate further in Chapters 3, 7 and 8.
The PMV model in particular became popular because an elegant formula can be used to calculate the expected thermal comfort, based on physical assumptions. This is attractive for heating, ventilation and air conditioning (HVAC) engineers, because calculating thermal comfort with the help of a formula is more familiar to them than having to take behavioural, psychological and social influences into account which are determined by building design and building physics parameters. The PMV/PPD model became the basis for standards and guidelines from the 1970s, which prescribe temperature limits for buildings and are still used today to design the indoor climate of buildings in large parts of the world with very different climate zones and cultures. Air conditioning technology allows the same indoor climate to be created anywhere in the world, in very different climates (Short, 2017) Thus, to this day, almost identical buildings are being created, from Dar es Salaam to Chicago and from Paris to Seoul (Figure 2.4). It goes without saying that a high price is paid for this in the form of energy consumption.

Figure 2.4: Building with glass facade in Madrid, Stockholm of Tokyo? Source: Publicdomainpictures.net.
Another factor in the popularity of climate chamber research has been that the responses of test persons in a carefully controlled environment have been considered scientifically more reliable than the responses of occupants in field studies, where all kinds of confounding factors may play a role. This overlooked the fact that the artificial conditions in the climate chamber are most likely not representative of normal living or working environments, and that the results of climate chamber studies therefore have lower ecological validity3, as shown below. The PMV model became commonplace in practice, but over time its limitations became increasingly apparent. Initially anecdotally by researchers who observed differences between thermal appreciation of people in buildings and the PMV predictions (Kurvers, 1986) and later by careful re-analysis of existing field studies (de Dear, Brager & Cooper, 1997; McCartney, 2002; Nicol & Humphreys, 2005). The PMV model has been found to predict thermal sensation well only in situations that closely resemble the conditions in climatic chambers, usually buildings with a closed façade and full air conditioning. Field studies showed that in naturally ventilated buildings and mechanically ventilated buildings without cooling, the PMV model overestimates thermal sensation and dissatisfaction at higher temperatures. The PMV model predicts that people are too hot, while in reality they are not. For example, a reanalysis of 8 field studies with a total of 66,500 observations (Figure 2.5), shows how much the actual judgements deviate from the PMV (Humphreys et al., 2016).
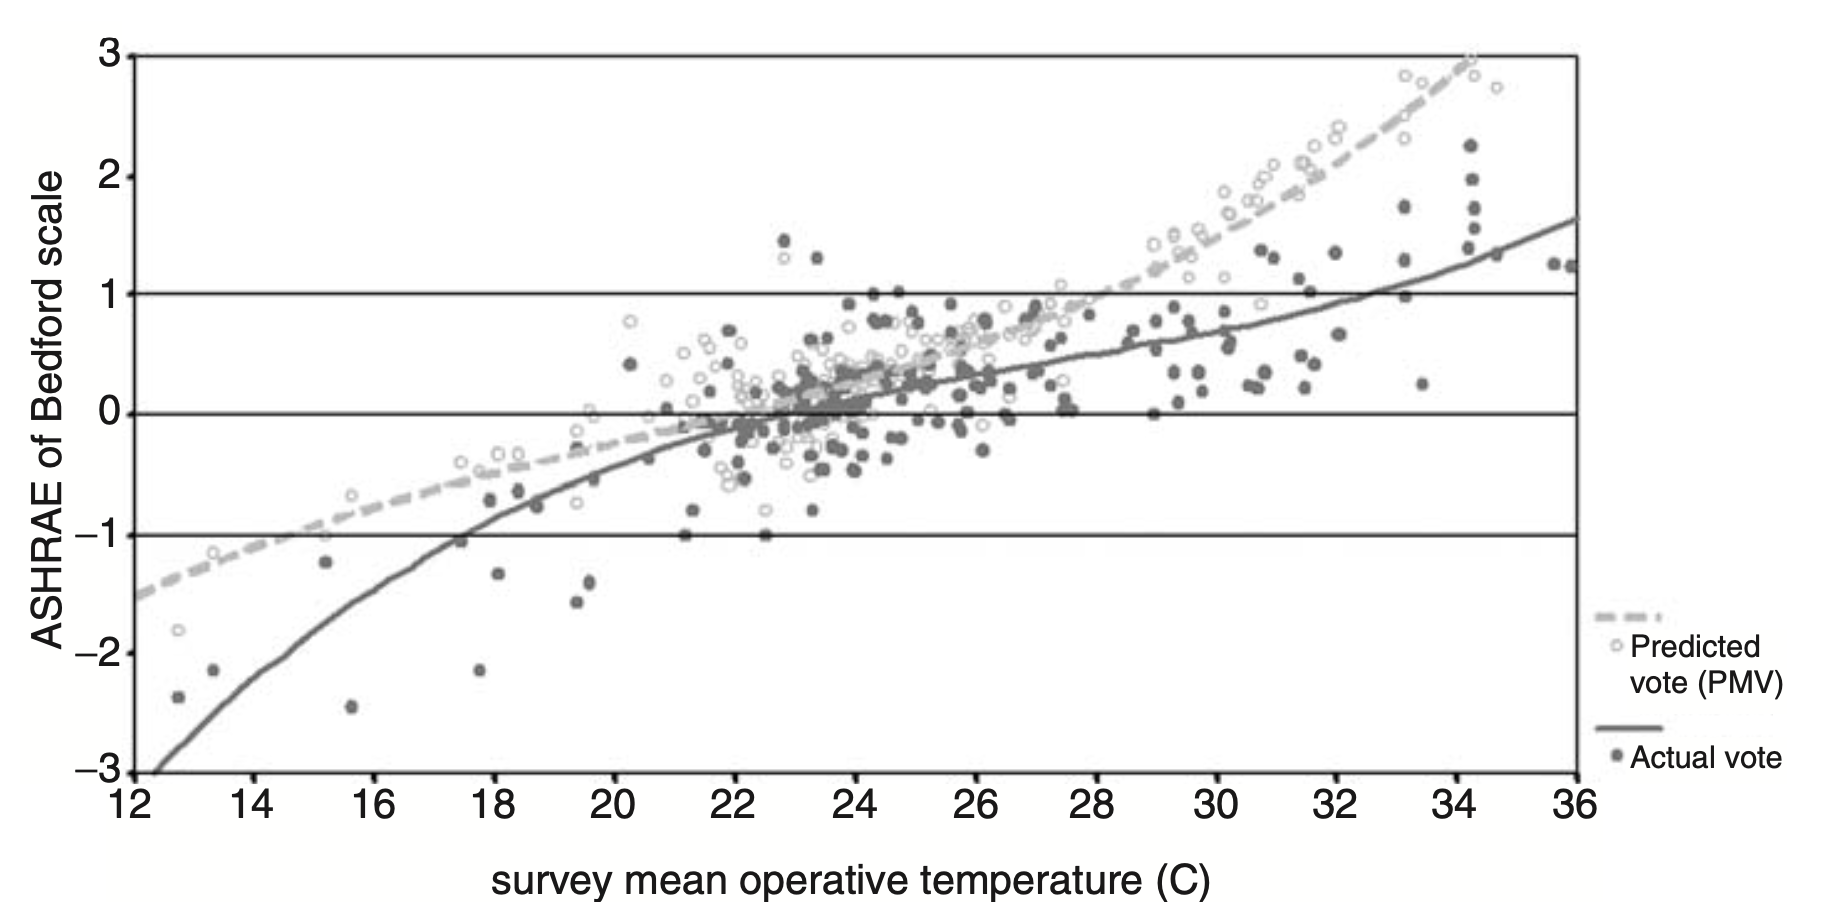
Figure 2.5: The calculated PMV (open points and dotted line) compared to the actual judgements (closed points and solid line) in 8 field studies with 66,500 observations. When people feel warmer than neutral in a warm environment, the PMV overestimates how warm they feel and thus the discomfort. Source: Humphreys et al., 2016.
2.5 Field studies
Even before the Second World War, field studies on the relationship between the thermal environment and human perception were conducted in various parts of the world. The first major study dates from 1936 and was conducted in Great Britain in twelve factories where 3085 women worked (Bedford, 1936). Temperatures were measured and questionnaires were used to assess whether the women were thermally comfortable. A seven-category scale, the Bedford scale, was used to indicate how warm or cold the workers were at a given time (Table 2.2). The mean comfort temperature appeared to be 18°C. This may seem on the cool side, but people in those days were dressed rather warmer and the investigated persons were doing light work.
Table 2.2: The Bedford scale for recording thermal sensation. Category 4 was later also referred to as “neutral” (Note: Although this scale also has seven categories, it differs in the phrasing of the categories from the ASHRAE scale used later. One similarity is that in both scales the middle three categories are considered comfortable). Source: Webb, 1959.
| Thermal sensation | Vote |
| 1 | Much too cool |
| 2 | Too cool |
| 3 | Comfortably cool |
| 4 | Comfortable and neither cool or warm |
| 5 | Comfortably warm |
| 6 | Too warm |
| 7 | Much too warm |
In the 1950s, more field research was done in workshops and offices, in Singapore, Iraq, India and Great Britain (Webb, 1959). For this purpose, the first data loggers for automatic recording of data were built (Figure 2.6). Webb found that the occupants of these buildings were comfortable at temperatures that were most common in the buildings during the relevant season. In these studies, temperatures ranged from 16°C in winter to 30°C in summer. Webb concluded that people adapted to the mean temperatures to which they were exposed over a long period of time. It was also found that thermal comfort was also related to the outdoor temperature on the day of the measurements and that the temperature at a given moment did not in itself say much about thermal comfort, but rather the deviation from the mean temperature during that period (Humphreys et al., 2016). The greater the deviation from the mean indoor temperature, the less comfortable the workers were.
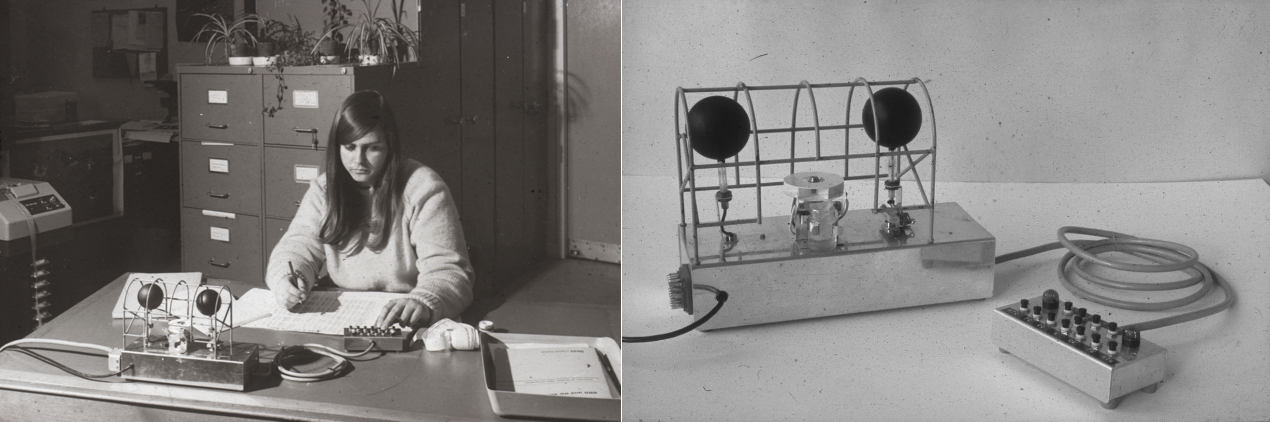
Figure 2.6: The data logger for measuring indoor temperatures, humidity and recording comfort votes on the 7-point scale. Source: Humphreys et al., 2016.
In the early 1970s, a large number of studies conducted in different parts of the world during the period 1938-1974 were combined and reanalysed (Humphreys, 1975). Figure 2.7 shows that during the season when the buildings were not heated or cooled, the free running mode, the neutral temperatures were strongly and linearly correlated with the outdoor temperature. The bandwidth of the buildings in the period that they are heated and/or cooled is greater and less strongly correlated with the outside temperature. The curvilinear correlation is caused by the fact that below a mean outdoor temperature of 0°C, neutral temperatures tend to rise again. There are only five observations here, so they could be outliers4, but it could also indicate that at sub-zero outdoor temperatures there is a need to be extra warm inside.
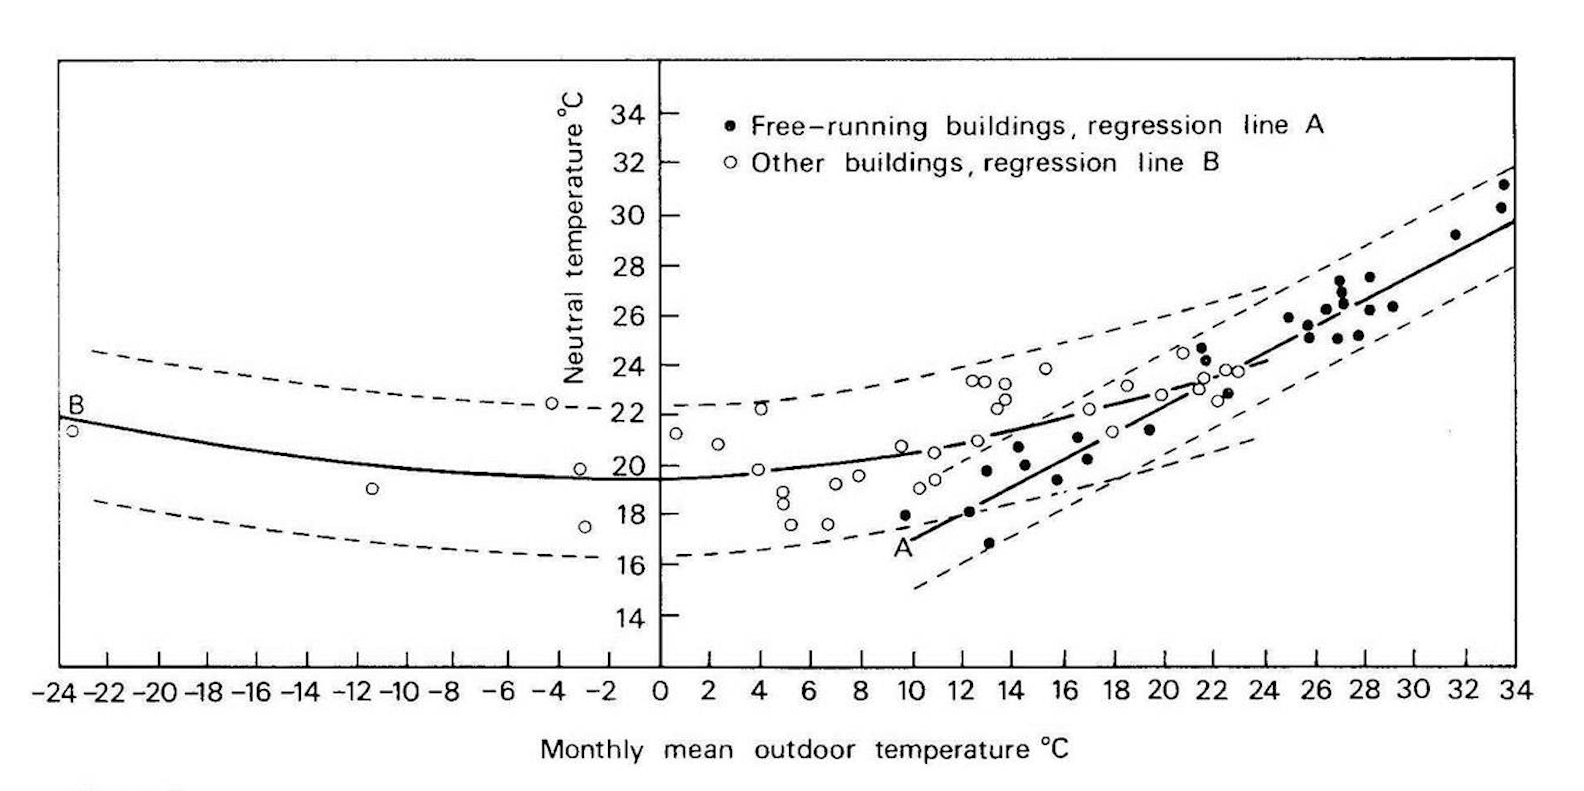
Figure 2.7: The indoor comfort temperature varies with the mean monthly temperature. For free running buildings the relationship is stronger than for buildings with heating and/or cooling. The solid lines are the averages of the values and 95% of the values lie between the dashed lines. Source: Humphreys, 1978.
The strong relationship between the outdoor temperature and the comfort temperature indoors in free-running buildings originates from the influence of the outdoor temperature on the indoor temperature. The warmer it gets outside, the warmer it gets inside and the occupants gradually get used to this, adjusting their clothing and opening and closing windows to achieve a temperature that is comfortable for them at that moment. It can also be seen that in heated/cooled buildings the neutral temperatures are mostly in a limited range: around 17°C to 24°C. In free-running buildings, even if the indoor temperature is influenced to some extent by building physics parameters such as thermal mass, glass percentage and insulation, the indoor temperature and therefore also the neutral temperature is strongly related to the outdoor temperature as line A in
Figure 2.7 shows. In buildings that are heated or cooled during a certain period, the indoor temperature is more strongly decoupled from the outdoor temperature and therefore the neutral indoor temperature is also less strongly related to the outdoor temperature and there will also be a larger bandwidth around the regression line, as shown by line B in
Figure 2.7. The accuracies of these relationships could be significantly improved with a better indicator for the outdoor temperature. At the time these studies were conducted, only mean monthly temperatures were available. In the following chapters it will become clear that a better indicator for outdoor temperatures also provides more accurate predictions of comfort temperature. The above shows that thermal comfort can be seen as a self-regulating system in humans (Figure 2.8.
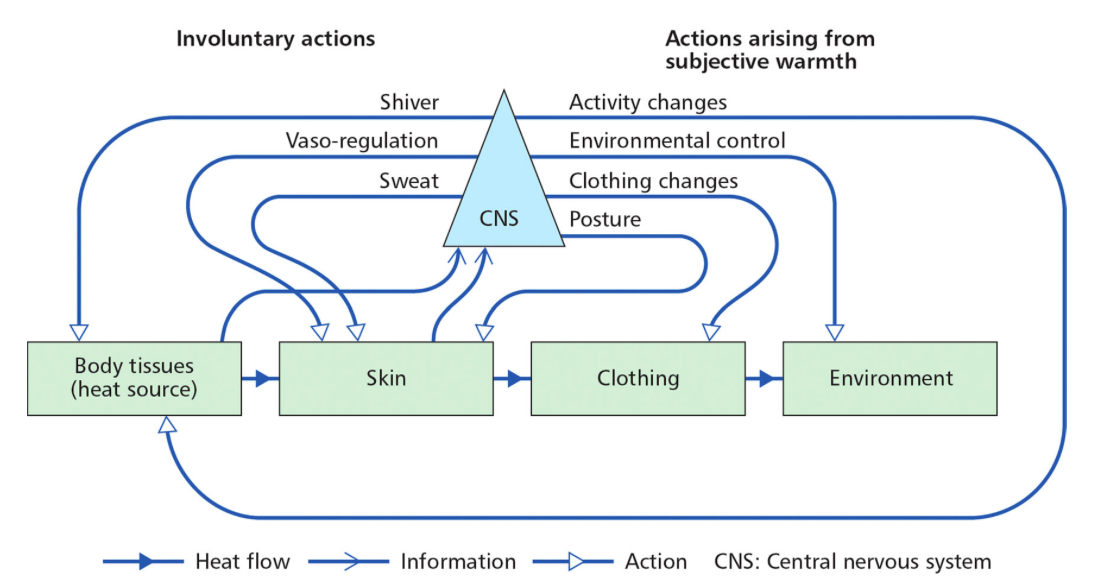
Figure 2.8: The human thermoregulation system. Source: Nicol & Roaf, 2017.
It consists of conscious and unconscious control loops. In the unconscious loops, the skin and the core of the body, where the heat is produced, provide information to the central nervous system so that action can be taken in the form of shivering or sweating and vasodilation or vasoconstriction, to keep the core temperature at around 37°C. Based on the subjective feeling of warmth, conscious control circuits behaviourally adjust the heat balance by adjusting the activity level and/or the clothing and/or, for example, opening a window. Especially these behavioural adjustments are essential for achieving thermal comfort. These data and models were very valuable for the design of buildings, but were mostly forgotten at the end of the 1970s when research in climate chambers became more fashionable.
2 The Pierce two-node model is a more complex model than the Fanger comfort equation and is composed of two concentric cylinders, one for the core of the body and one for the skin (Doherty & Arens, 1988).
3 Ecological validity is the extent to which the measurement results are representative of everyday practice and therefore do not apply only within the test environment.
4 An outlier is a data point that deviates (strongly) from the rest of the data. The problem with outliers is that they can strongly distort the data. However, correcting for outliers can also distort research results.