6. Thermal Comfort in Standards and Guidelines
6.1 Introduction
Initially, from the 1970s onwards, standards and guidelines for thermal comfort were based on research in climate chambers, particularly on the PMV/PPD model. Based on renewed field research since the turn of the century, standards have been extended to include guidelines for naturally ventilated, non-cooled buildings. In the following paragraphs, the standards are briefly addressed and the problems that the current standards and their classifications can lead to are discussed. Finally, a method to interpret the results of temperature simulations or measurements is described.
6.2 EN-ISO 7730 standard
The EN-ISO 7730 standard “Ergonomics of the thermal environment-Analytical determination and interpretation of thermal comfort using calculation of the PMV and PPD indices and local thermal comfort criteria” (EN-ISO 7730, 2005) is an analytical method based on the Fanger climate chamber study (Section 2.4). As an example, Table 6.1 shows some design temperatures from EN-ISO 7730. It is assumed here that the mean radiant temperature is virtually the same as the air temperature.
Table 6.1: Design temperatures for summer and winter for two different activity levels in EN-ISO 7730. For summer a clothing insulation value of 0.5 clo and for winter 1.0 clo is taken. A turbulence intensity of 40% is used for the air speed (mixed ventilation). Source: EN-ISO 7730, 2005.
|
Type of building/space |
Activity (W/m2) |
Category |
PPD (%) |
Operative temperature (°C) |
Maximum mean air velocity (m/s) |
||
|
Summer 0,5 clo |
Winter 1,0 clo |
Summer 0,5 clo |
Winter 1,0 clo |
||||
|
Single office Landscape office Conference room Auditorium Cafeteria/restaurant Classroom |
70 |
A |
< 6 |
24,5 ± 1,0 |
22,0 ± 1,0 |
0,12 |
0,10 |
|
B |
< 10 |
24,5 ± 1,5 |
22,0 ± 2,0 |
0,19 |
0,16 |
||
|
C |
< 15 |
24,5 ± 2,5 |
22,0 ± 3,0 |
0,24 |
0,21 |
||
|
Department store |
93 |
A |
< 6 |
23,0 ± 1,0 |
19,0 ± 1,5 |
0,16 |
0,13 |
|
B |
< 10 |
23,0 ± 2,0 |
19,0 ± 3,0 |
0,20 |
0,15 |
||
|
C |
< 15 |
23,0 ± 3,0 |
19,0 ± 4,0 |
0,23 |
0,18 |
||
The table distinguishes between three indoor climate categories, assuming that category A provides more comfort than categories B and C, while category B provides more comfort than category C. Originally, EN-ISO 7730 was intended for all types of buildings. The results of field studies have now shown that this standard is not valid for naturally ventilated, non-cooled environments. However, this standard can still be used for the design of air-conditioned environments.
6.3 EN 16798-1 standard
European standard EN 16798-1 “Energy performance of buildings - Ventilation for buildings - Part 1: Indoor environmental input parameters for design and assessment of energy performance of buildings addressing indoor air quality, thermal environment, lighting and acoustics - Module M1-6” (EN 16798-1, 2019) is based on both the conventional PMV/PPD model and the adaptive model (based on the SCATs database). The PMV/PPD model is still considered the leading model. Section 6.1.1 of EN 16798-1 states: “Criteria for the thermal environment in heated and/or mechanical cooled buildings shall be based on the thermal comfort indices PMV-PPD (EN ISO 7730), with assumed typical levels of activity and typical values of thermal insulation for clothing (winter and summer)”. EN 16798-1 distinguishes four comfort categories (Table 6.2). According to this standard “the categories are related to the level of expectations the occupants may have. A normal level would be “medium”. A higher level may be selected for occupants with special needs (children, elderly, persons with disabilities, etc.). A lower level will not provide any health risk but may decrease comfort. Selection of the category is building, zone or room specific, and the needs of special occupant groups such as elderly people (low metabolic rate and impaired control of body temperature) shall be considered. For this group of people it is recommended to use category I requirements”.
Table 6.2: Comfort categories for design of mechanically heated and cooled buildings. Source: EN-16798-1, 2019.
|
Category |
Predicted Percentage of Dissatisfied PPD (%) |
Predicted Mean Vote PMV |
Level of expectation |
|
I |
<6 |
-0,2<PMV<+0,2 |
High |
|
II |
<10 |
-0,5<PMV<+0,5 |
Medium (Normal) |
|
III |
<15 |
-0,7<PMV<+0,7 |
Moderate |
|
IV |
<25 |
-1,0<PMV<+1,0 |
Low |
In Section B2.2 of EN 16798-1 recommended ranges of indoor operative temperatures are presented for buildings without mechanical cooling systems as function of the outdoor running mean temperature (Figure 6.2). This alternative method only applies for office buildings and other buildings of similar type (e.g., residential buildings) used mainly for human occupancy with mainly sedentary activities, where there is easy access to operable windows and occupants can freely adapt their clothing to the indoor and/or outdoor thermal conditions, where thermal conditions are regulated primarily by the occupants through opening and closing of openings (windows) in the building envelope. The adaptive comfort limits (Figure 6.2) are considered in this part of the standard as an alternative method that can be used under specified conditions.
The bandwidths of the different categories are determined according to the relationship of the percentage of people who are not comfortable with the deviation from the neutral temperature, as shown in Figure 6.1. The running mean external temperature14 is determined as described in the explanation of the SCATs study in Section 3.3.
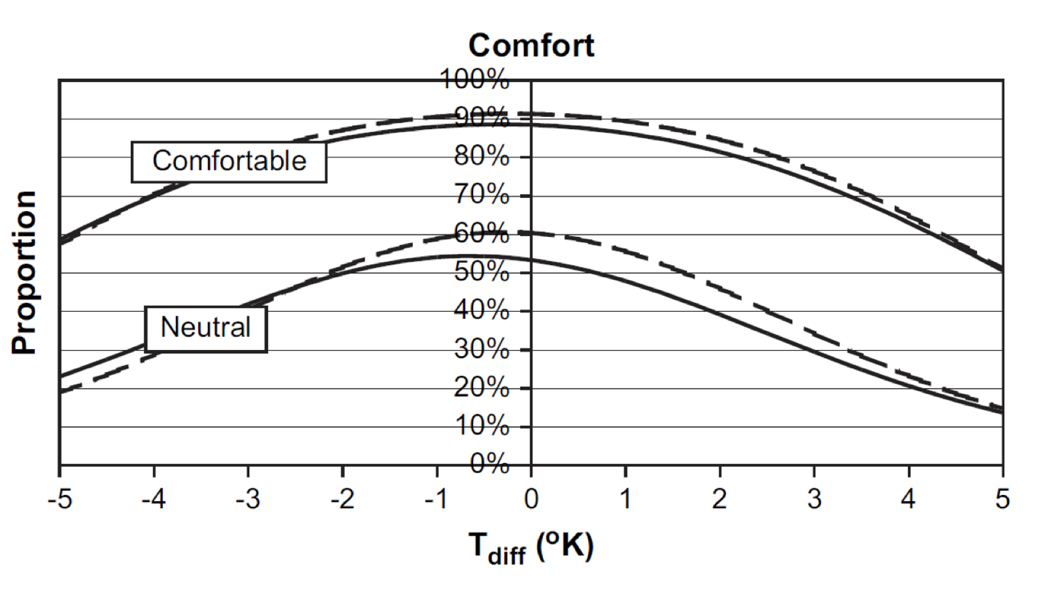
Figure 6.1: Percentage of people who feel comfortable and neutral respectively for free-running (solid line) and air-conditioned (dashed line) buildings, depending on deviation from Mean neutral temperature. Source: Nicol & Wilson, 2010.
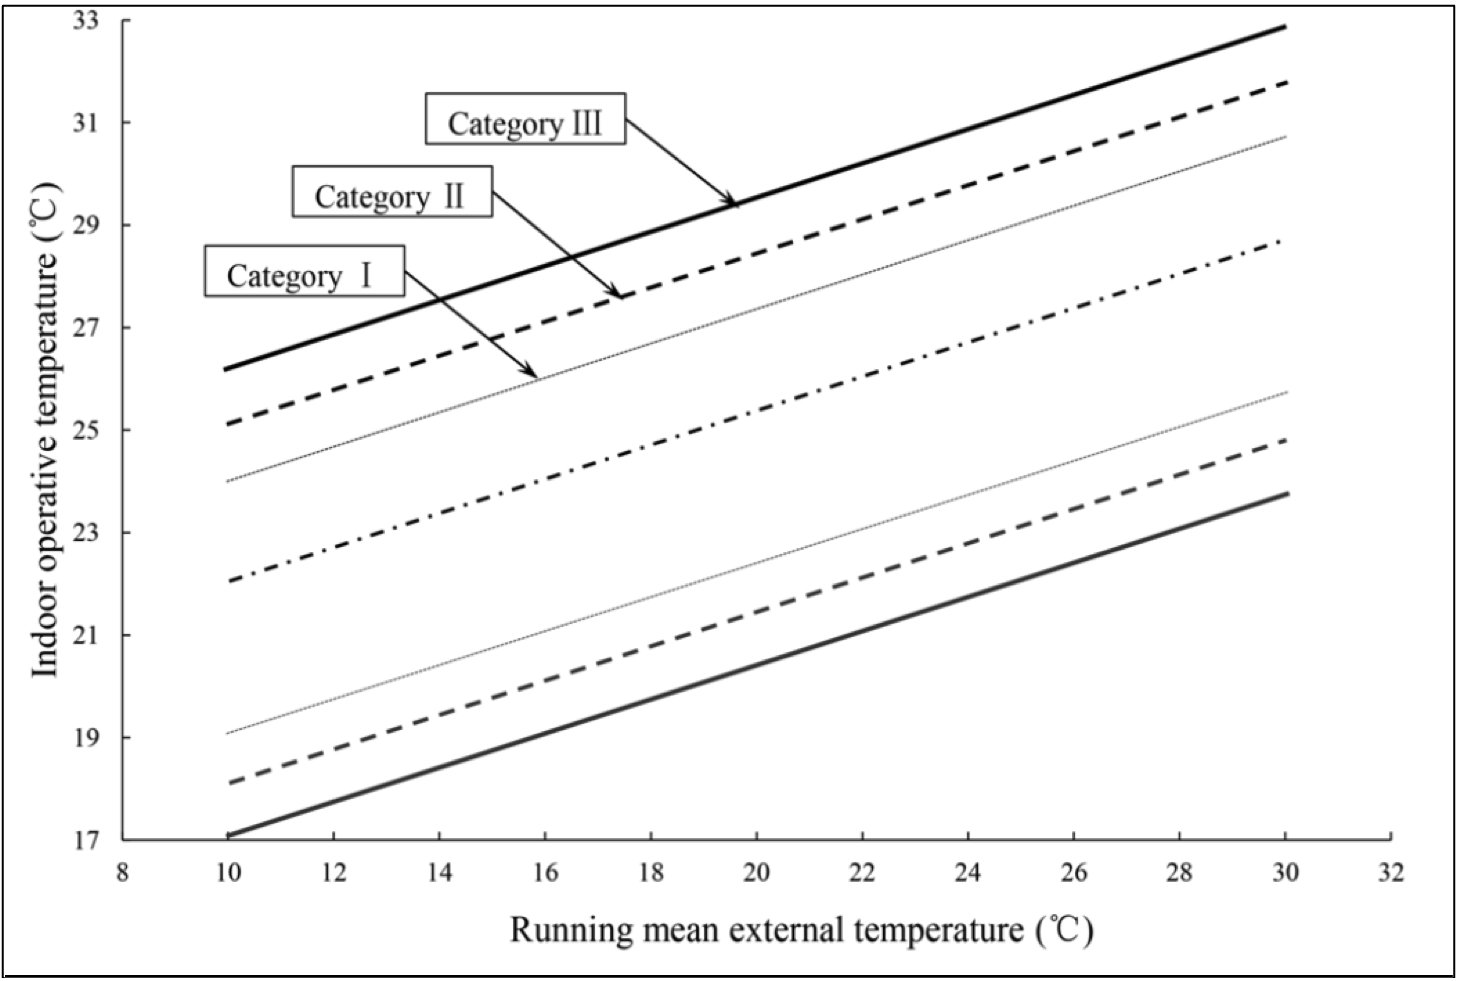
Figure 6.2: Default design values for the indoor operative temperature for buildings without mechanical cooling systems as a function of the exponentially-weighted running mean of the outdoor temperature. Source: EN 16798-1, 2019.
6.4 ASHRAE standard 55
In the American ASHRAE Standard 55, “Thermal Environmental Conditions for Human Occupancy” (ASHRAE, 2017), the adaptive model is also an optional method, in addition to the PMV/PPD method, which can only be applied under the following conditions:
No mechanical cooling is installed;
The metabolism of the occupants is between 1.0 and 1.3 Met;
Occupants are free to adjust their clothing to the indoor and/or outdoor conditions within a range of at least 0.5 to 1.0 clo;
The prevailing outdoor temperature is higher than 10°C and lower than 33.5°C.
The limit values for the adaptive standard are shown in Figure 6.3, where two categories are distinguished:
90% or more acceptability;
80% or more acceptability.
The limit values are derived from the results of RP884 (see Section 3.2). The limit values for 80% acceptability correspond to those in Figure 3.1.
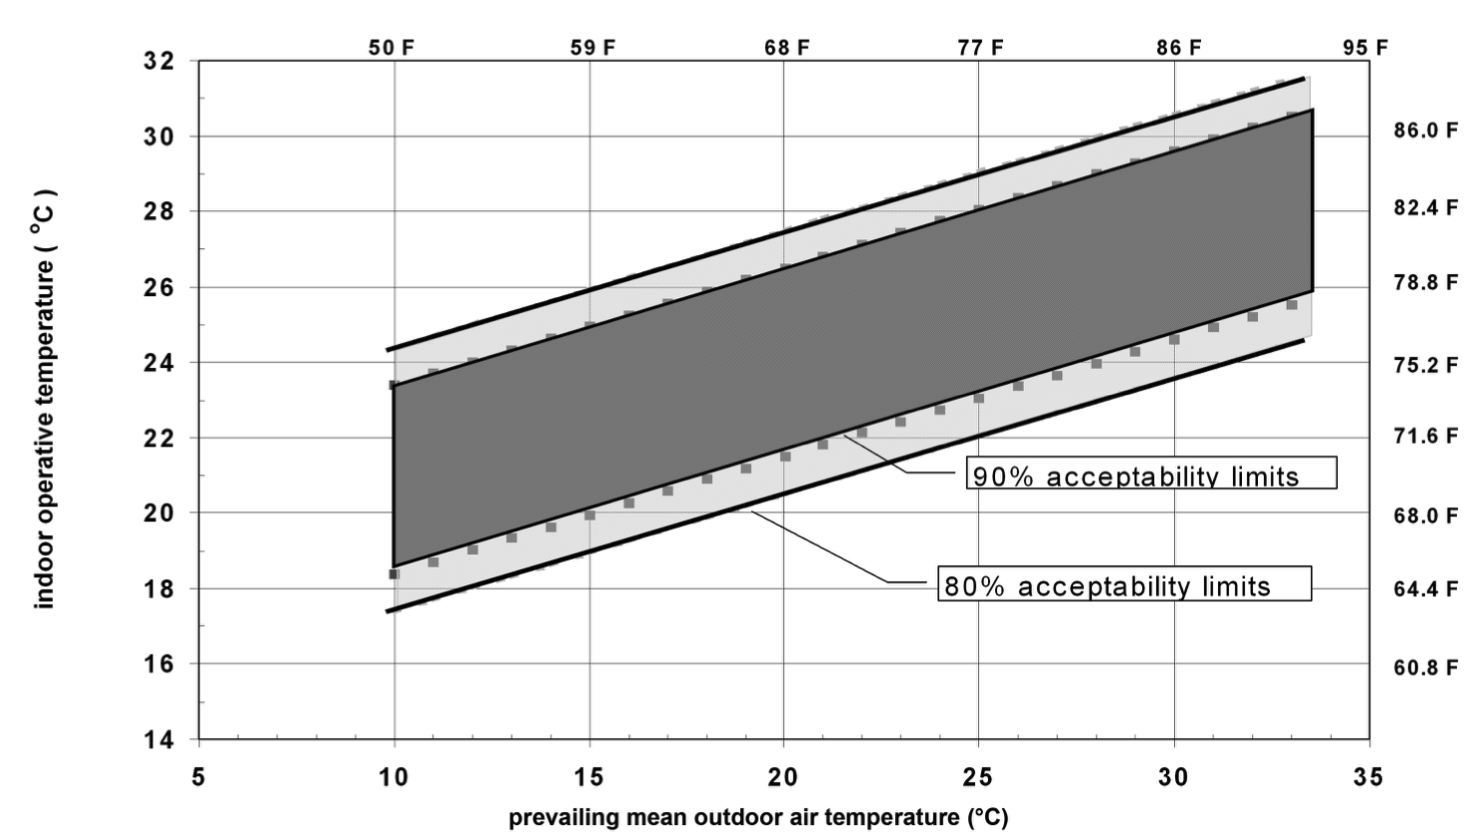
Figure 6.3: The adaptive ASHRAE standard 55 for naturally ventilated rooms as a function of the prevailing outdoor temperature. Source: ASHRAE, 2017.
6.5 Assessment of temperature exceedance
When simulating the thermal behaviour of buildings, in practice the results of temperature simulations for fully air-conditioned buildings are assessed on the basis of temperature exceedances or weighted temperature exceedances. This allows a certain degree of exceeding of the fixed limits in the standards, with the aim that a design is not rejected on the basis of a few exceedances limited in time and scope. Testing is very important, especially in light of the warming climate and because the results of building simulations have far-reaching consequences for energy use and indoor climate quality. Below is a proposal, taken from the adaptive approach in CIBSE TM52 (CIBSE, 2013), on how to interpret exceedances in non-cooled or moderately cooled buildings. Finally, three criteria are given for possible exceedances. If all three criteria are met simultaneously, the design need not be rejected, despite the exceedances. The lines indicating the comfort range (category II in EN 16798-1) should not be interpreted as sharp boundaries. The bandwidth is the percentage of acceptability or discomfort as a function of the deviation from the Mean neutral or comfort temperature. So even within the bandwidth there is always some degree of discomfort due to differences between people. It is in the nature of distributions that discomfort is gradual and therefore has no precise or sharp boundary. A little below or above the boundary line therefore has little effect on the degree of comfort.
The results of temperature simulations are sensitive to differences in, for example, inaccuracies in input parameters of building physics and installation properties, differences in weather data, differences in simulation software and differences in occupancy hours. This can lead to calculated temperature distributions in which a part of the temperatures is just inside or just outside the boundary. In practise this situation is often interpreted in black and white: within the bandwidth there is no discomfort and outside it there is and the situation is therefore rejected. However, in reality the standard indicates from which boundary a certain degree of discomfort is exceeded. Therefore, a method has been developed by CIBSE (CIBSE, 2013) to test temperature discomfort calculations against adaptive limits. It is important to understand that discomfort is not a function of temperature, but of the deviation from the comfort temperature. Figure 6.4 shows that the percentage of people who feel discomfort varies with the deviation from comfort temperature.
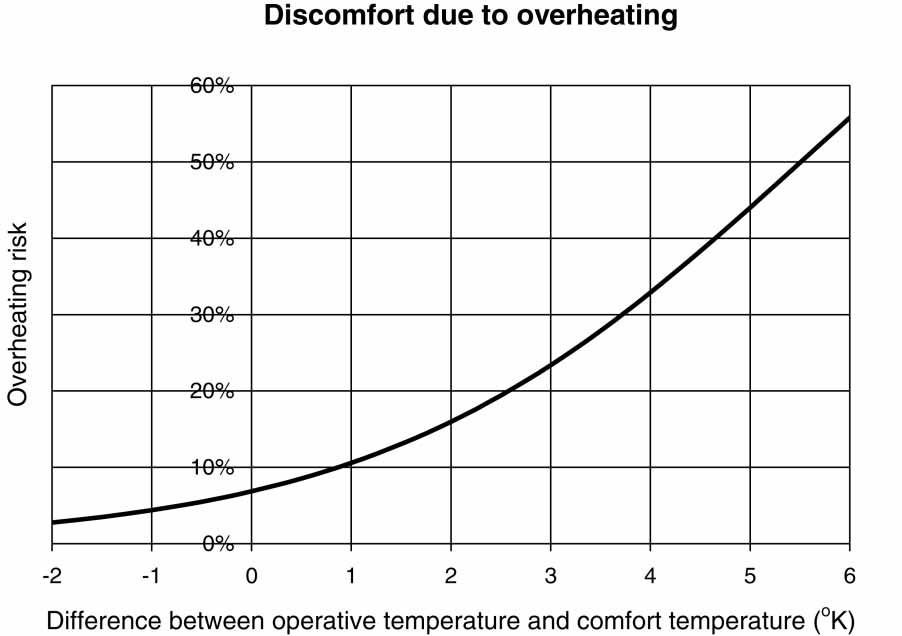
Figure 6.4: The increase in thermal hot discomfort, depending on the difference between the comfort temperature and the operative temperature. This shows that there is also discomfort at the design temperature and that there is no sharp boundary. Source: CIBSE, 2013.
In the CIBSE standard, the results of building temperature simulations are assessed against the following criteria:
Category II of EN 16798-1 (EN 16798-1, 2019). The upper limit of the comfort zone is determined from:
Tmax = 0.33 Trm + 21.8
where Tmax is the maximum accepted temperature (°C). For Trm see Section 2.5.
Conditions are then set for ∆T, the difference between the calculated or measured operative temperature Top and the maximum acceptable temperature Tmax:
∆T = Top - Tmax
∆T is rounded to whole degrees (e.g., ∆T between 0.5 and 1.5 becomes 1°C).
As stated above, due to the nature of the calculations, not all calculated temperatures can fall within the range and therefore additional conditions are imposed:
The number of hours Hethat >∆T is greater than or equal to 1°C during the period May - September shall not exceed 3% of the total number of hours of occupancy per year.
In addition to a limit on the number of hours, there is also a criterion for the degree of exceedance.
Per day, the weighted excess We shall not exceed 6:
We = (Σhe) x WF
= (he0 x 0) + (he1 x 1) + (he2 x 2) + (he3 x 3)
where weighting factor WF = 0 if ∆T ≤ 0, otherwise WF = ∆T and hey is the time (h) when WF = y.
Example: In a temperature simulation, a temperature is calculated every half hour during an 8-hour occupation. There are 16 values, of which ten are ∆T = 0 or negative (WF = 0), three are ∆T = 1 (WF = 1), two are ∆T = 2 and one is ∆T = 3 (WF=3), so:
We = ½ [(10 x 0) + (3 x 1) + (2 x 2) + (1 x 3)] = 5
(the condition is fulfilled)
Finally, an absolute maximum is set for the operative indoor temperature of:
∆T ≤ 4°C
Above this value, no normal adaptive measures to restore thermal comfort are possible. Condition 3 is a protection against possible future heat waves (Section 6.6). The values for He ≤ 3% and We ≤ 6 are based on practical studies and for a detailed description and justification of this method, please refer to CIBSE (2013).
Figure 6.5 give examples of temperature simulations in 2 naturally ventilated buildings, where in building A, although there is some excess of the adaptive limit, criteria 1, 2 and 3 are still met. In building B, the exceedances are even slightly larger but conditions 1 and 2 are no longer met.
(For more information concerning CIBSE TM52 Thermal comfort analysis see: https://energy-test.co.uk/thermal-comfort-analysis/).
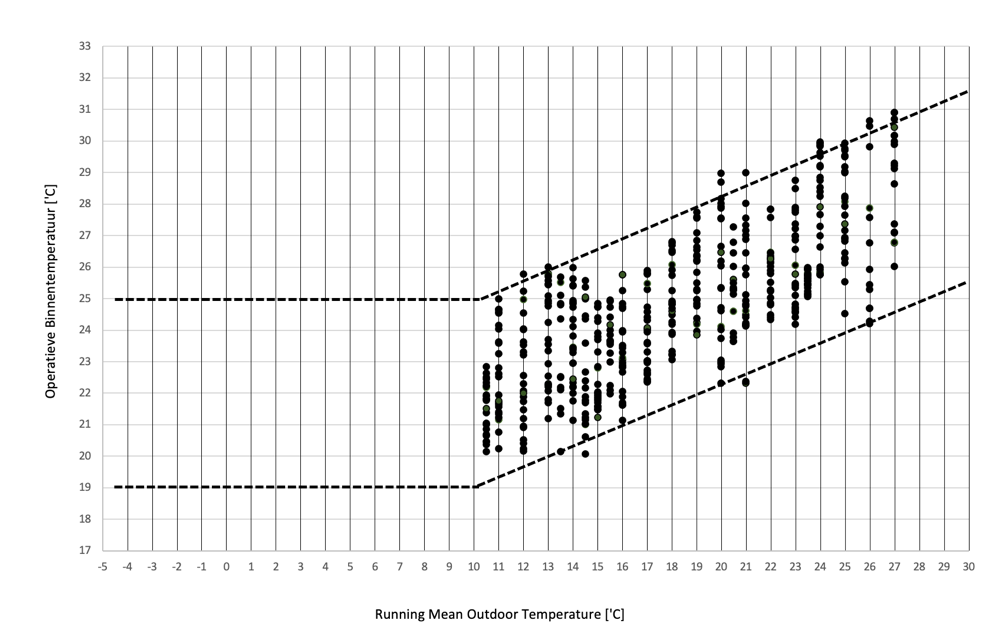
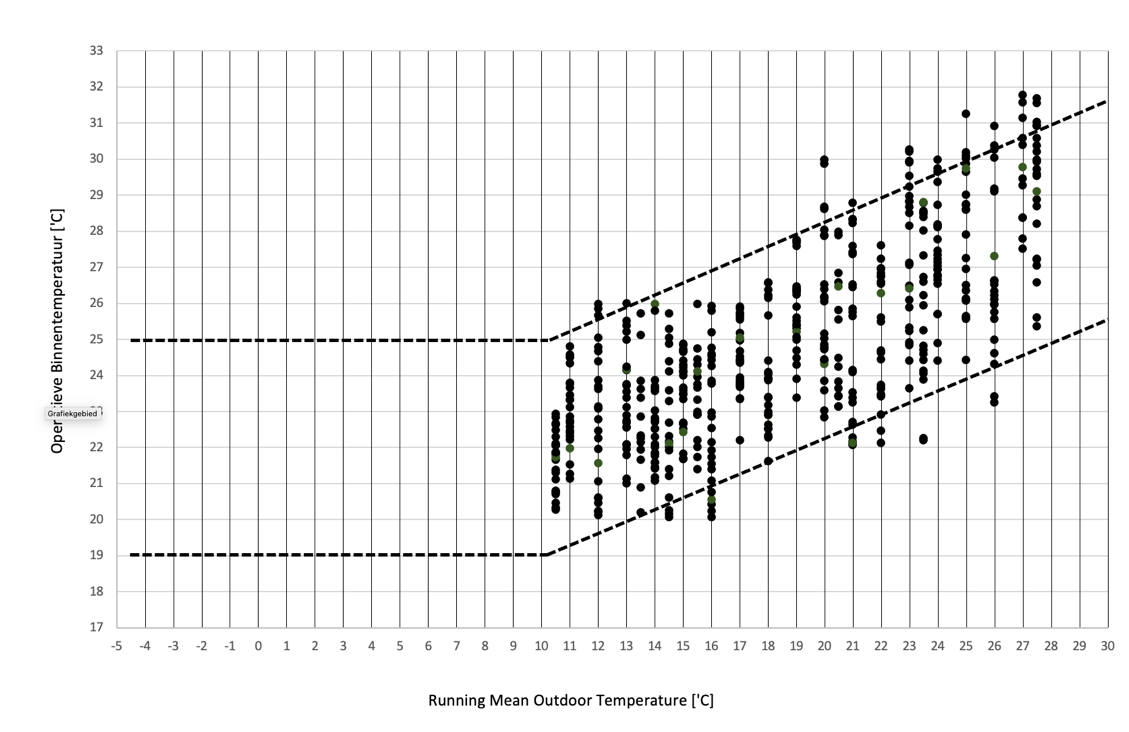
Figure 6.5: Examples of temperature simulations in naturally ventilated buildings. Above building “A”: Criteria 1, 2 and 3 are met. Below building “B”: Criteria 1 and 2 are not met.
6.6 Heat waves
A heat wave is a period of at least five days with temperatures of 25 degrees or more. On at least three days a tropical temperature of 30 degrees or more must be reached. The number of official heatwaves in the Netherlands since 1901 at De Bilt is 29. Over the period 1901-2000 the counter stood at 16 heatwaves in total, which corresponds to an Mean of once every six years. In this century there have already been 13 heat waves. This number has been reached in a period of just over twenty years. This means that, on average, we are now faced with a heat wave once every eighteen months. In other words, two out of every three years we experience a period of heat.
According to the climate scenarios of the Royal Dutch Meteorological Institute (KNMI), we can expect around 7 to 13 tropical days in the year 2050. At the moment (2020), there are 5 tropical days per year. In both 2018 and 2019, there were two official heat waves. In 2020 one heat wave was recorded. In this century, the longest period without a heat wave was seven years. No official heat wave was recorded between July 2006 and July 2013. In the previous century, there was no official heatwave for 28 years between July 1948 and June 1976. A heat wave was a rare occurrence and an entire generation grew up without it. Nowadays, it is quite normal for a heat wave to occur in summer. Not only is the number of heat waves increasing, the number of warm summer days and tropical days is also rising. At the beginning of the last century, during the climate period 1901-1930, a mean of 66 warm days with a temperature of at least 20 degrees was recorded in a year. On 13 of those days, the temperature rose to 25 degrees or more and on an average of 1 day it became tropically warm with values of 30 degrees or more. In the period 1961-1990, a slight increase was visible. The number of warm days with temperatures of 20 degrees or more was 71, the number of summery days 19 and the number of tropical days 2. Over the period 1991-2020, the annual number of warm days is no less than 93. On 28 of those days the temperature was at least 25 degrees and on an average of 5 days per year the mercury rose to 30 degrees or more (KNMI, 2020). The implications for building design will be discussed in Section 11.6.
14 In literature and standards, the terms external temperature and outdoor temperature are used interchangeably.