10. Productivity, temperature and thermal comfort
10.1 Introduction
Since the thermal environment affects physiological, psychological and behavioural processes (Chapter 4), it can be assumed that it therefore also affects workers’ performance or productivity. In recent years, much research has been published on the empirical relationship between temperature, thermal sensation and work performance. However, the results are not always clear. This is mainly because performance is difficult to quantify due to the different types of work and test methods. Performance can be studied with (simulated) office work, psychological tests, or self-reported performance. In addition, the environment can be quantified by air temperature, by an index such as the PMV or by subjective thermal comfort. Most of these publications are based on research in air-conditioned buildings or climate chambers with active cooling. Moreover, it appears that the relationships between temperature and performance in air-conditioned environments are not representative of passive climate-controlled buildings and that the arguments for cooling workplaces for higher performance do not apply to passive buildings where people can adapt to conditions.
10.2 Performance and temperature
In an often-cited meta-analysis of research on the influence of indoor temperature on objectively measured performance, office work performance is highest when the indoor temperature is around 22°C (Wargocki et al, 2006, 2007). At higher or lower temperatures, performance decreases (Figure 10.1). According to this analysis, the relationship is only statistically significant below 20°C and above 24°C. Thus, there is a plateau between 20°C and 24°C where performance is at its maximum. This interpretation is supported by Zhang, de Dear & Hancock (2019) who argue on both empirical and theoretical grounds that in a relationship between an environmental variable and performance, an inverted U-shaped curve with a plateau is more likely than an inverted U curve without a plateau.
These results are widely accepted and it is often concluded that when the temperature in buildings rises above 22°C or 24°C, the productivity of staff will decrease, even if they feel comfortable at that temperature. The question is whether this relationship is also valid for passively conditioned/non-cooled buildings. To this end, the descriptions of the studies on which the meta-analysis is based (Seppänen et al., 2003; Wargocki et al., 2006) and the original studies themselves were examined in more detail. This shows that 15 of the 24 studies are based on experiments in climate chambers, 5 were conducted in air-conditioned buildings with a closed façade and 2 in air-conditioned buildings with limited usable windows.
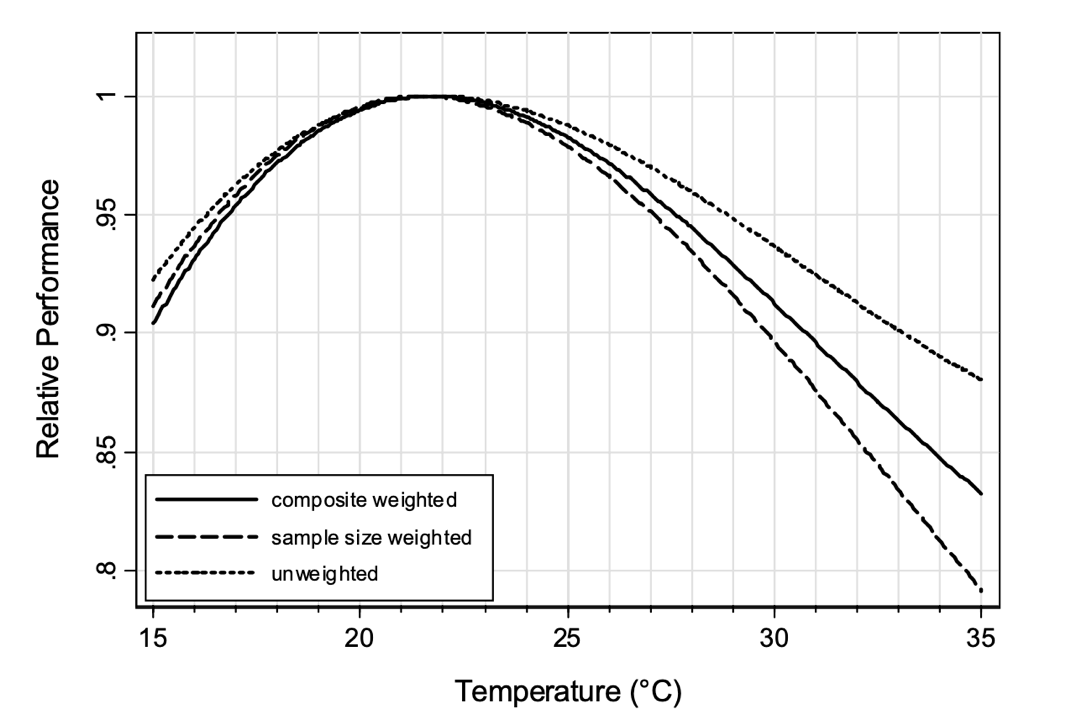
Figure 10.1: Relative performance versus indoor temperature. The maximum performance is set to 1. “Unweighted” means that the data of the different studies are not weighted, “sample size weighted” means that the data of the different studies are weighted with the number of subjects per study, “composite weighted” means that the data of the different studies are weighted with the number of subjects per study and the relevance of the performance scores for office work. This publication assumes that the composite weighted curve is the best indicator of performance in office work. Source: Wargocki et al., 2006.
One study was conducted in a mechanically ventilated office building without active cooling but without openable windows, and one study was performed in an industrial building without cooling. Thus, of the 24 underlying studies, 22 were conducted in conditioned environments. It is also stated that the relationship found relates to office work in general. The results are based not only on typical office work (in the experiments mostly work in call centres), various mental work and learning tasks, but also on driving skills, simulated factory work and working in a sewing workshop. In the meta-analysis, the results of these different types of work have been combined into a single equation, even though it is conceivable that they are related to temperature to different proportions. The question therefore remains whether the distribution found relates to the pure relationship between office work and temperature, or to the various underlying relationships. This is only partly solved by giving the tasks that are less similar to office work a lower, arbitrary weighting factor in the composite weighted analysis.
Another problem is that five of the six field studies on objectively measured work performance are based on data from call centres. The advantage of this approach is that the individual performance of call centre employees can easily be derived from the call records and that other data, such as the time of day, can also be included. In general, this approach appears to work well: in four of the five call centre studies, call duration, processing time or a combination of the two increases when temperatures are less comfortable. This is cross-validated by Wargocki et al. (2004), who showed that with lower air quality, mean call duration increased. Whether the quantitative effect of temperature on call centre work is also representative of other types of office work remains to be seen, although there is no reason to expect major differences.
All in all, it can be concluded that in actively air-conditioned environments productivity is highest at temperatures between 20°C and 24°C. This area corresponds well to the comfort zone in air-conditioned buildings according to the PMV model, assuming a metabolism of 70W/m2 and a clo-value of 1.0 clo, which is sufficiently representative based on the descriptions of the underlying studies. Productivity decreases as the temperature falls below 20°C or rises above 24°C. This is a less definite relationship than shown in Figure 10.1, and does justice to the conclusion of Wargocki et al. (2006, 2007), that the relationship has a high degree of uncertainty.
The question then arises as to whether the correlation found is also valid to some extent for free-running buildings. In that case, for example, productivity would be 6% lower at 28°C than in an actively air-conditioned office at 22°C. As mentioned, none of the 24 underlying studies took place in naturally ventilated office buildings. Occupants of free-running buildings have a different thermal experience, preferring a higher indoor temperature in summer and showing much more adaptive behaviour than in air-conditioned buildings, in particular adjusting their clothing insulation and the air velocity by opening the windows.
Next, the extent to which adaptation plays a role in the studies underlying Wargocki, et al. (2006, 2007) is examined. First, 21 of the 24 underlying studies relate to buildings without openable windows, 2 to buildings with limited useable openable windows and one to buildings with openable windows. So there were hardly any subjects who could adjust air speed and air temperature by opening windows.
Secondly, in 14 of the 15 laboratory studies, the clothing insulation was either prescribed by the researcher or the subjects were asked not to change their clothing during the study. One experimental study did ask subjects to adjust their clothing in order to maintain a thermally neutral experience and found no significant effect of temperature on performance. One might expect that in the field studies, where subjects were free to adjust their clothing, they would do so to the same extent as in free running buildings. However, Chapter 3.2 showed that occupants of air-conditioned buildings adjusted their clothing insulation to a much lesser extent than occupants of naturally ventilated buildings.
Finally, in all 15 climatic chamber studies, there was no relationship between the indoor and outdoor temperature. In at most 3 of the 9 field studies, this relationship could be expected to some extent based on the description of these buildings.
In summary, in almost all of the studies underlying the meta-analysis (Wargocki, et al., 2006, 2007), the major forms of adaptation that enable users of naturally ventilated buildings to accept and prefer higher indoor temperatures in summer than users of air-conditioned buildings were severely limited or did not function. If air-conditioned and naturally ventilated buildings differ so much in terms of thermal comfort and occupant behaviour, it cannot be excluded that there is also a (significant) difference in the influence of temperature on performance. Therefore, the meta-analysis cannot be considered representative of free-running environments.
A recent meta-analysis is based on 35 studies on the effect of indoor temperature on performance in office work (Porras-Salazar et al., 2021). The methodology in this study is similar to that of the meta-analysis in Wargocki et al. (2006, 2007), but is based only on studies of cognitive skills essential for office work or actual office work in office-like environments. Also excluded were studies with only self-reported performance or physiological measurements. Some of the 24 studies on which Wargocki et al. (2006, 2007) is based were therefore dropped, but on the other hand studies not included in Wargocki et al. (2006, 2007) were included. In total, the meta-analysis is based on 35 studies, some of which were also used in Wargocki et al. (2006, 2007). Of these, 33 were conducted in controlled environments, i.e. not in real-life situations. This means that the result, like the correlation in Wargocki et al. (2006, 2007), is not representative for free running environments.
The results are given in Figure 10.2. No relationship is found between indoor temperature and performance. The explained variance (R2) is very low: 2%, and the relationship is not statistically significant. This applies to both the 20°C to 30°C temperature bandwidth representative of offices and the broader range between 18°C and 34°C.
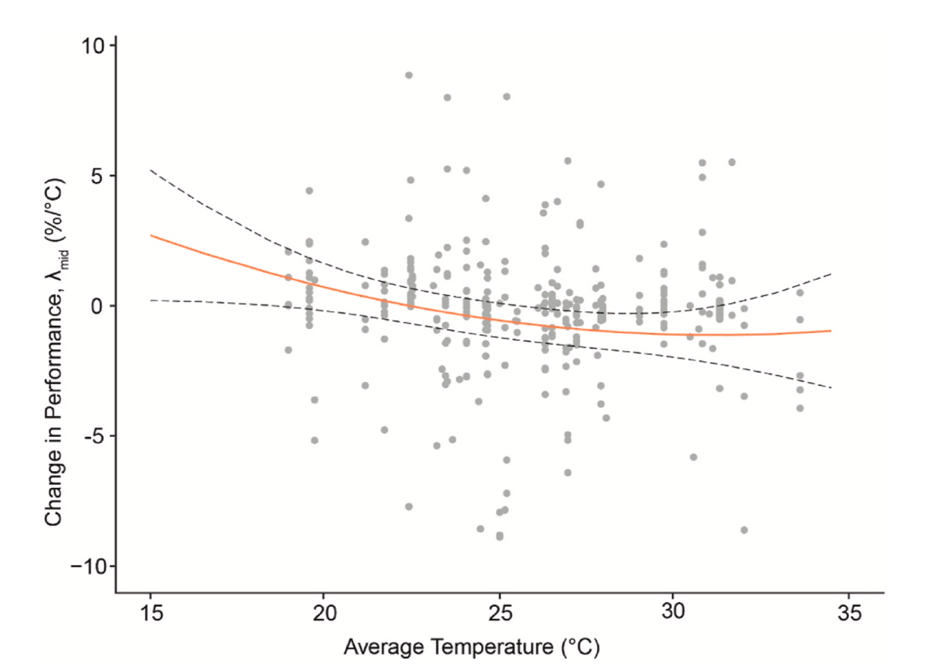
Figure 10.2: The relationship of change in performance with mean temperature. The red line shows the correlation, the dashed lines the 95% confidence interval. The grey dots are the original data points. λmid is the change in work performance in % per 1°C increment in temperature, whereby positive λmid indicates an increase in performance with increasing temperature; while negative λmid indicates a decrease in performance with increasing temperature. Source: Porras-Salazar et al., 2021.
The article identifies several limitations of this meta-analysis. The main ones are the differences in methods of determining performance, multiple confounders that were not corrected for, and the fact that temperature alone may not fully describe how the thermal environment affects performance. The paper argues that these limitations may be the cause of the failure to find a link between performance and temperature and that, if these limitations were removed, a link might be found. Therefore, the article concludes that the lack of a link does not necessarily disprove that temperature has an effect on office performance. In fact, the idea that temperatures between about 18°C and 34°C have an effect on office performance has been disproved by the results as long as there are no new research results to the contrary. Of course, the limitations mentioned should be avoided in future research, but it is not possible to know in advance what the results will be.
10.3 Performance, thermal sensation and thermal satisfactions
In addition to the relationship of performance with objectively measured temperature, other researchers have also investigated the relationship with subjective thermal sensation vote (TSV). Figure 10.3 shows a relationship between the TSV and the objectively measured performance (Jensen, 2008). The equation found is:
Relative performance = - 0.0029 TSV2 - 0.0034 TSV + 0.999 (1)
This relationship is based on four experimental studies in climate chambers and in air-conditioned office rooms where the temperature was set by the researchers. The subjects performed simulated office work (calculation and/or word processing) at different temperatures. They were asked to indicate their thermal perception on the 7-point ASHRAE scale.
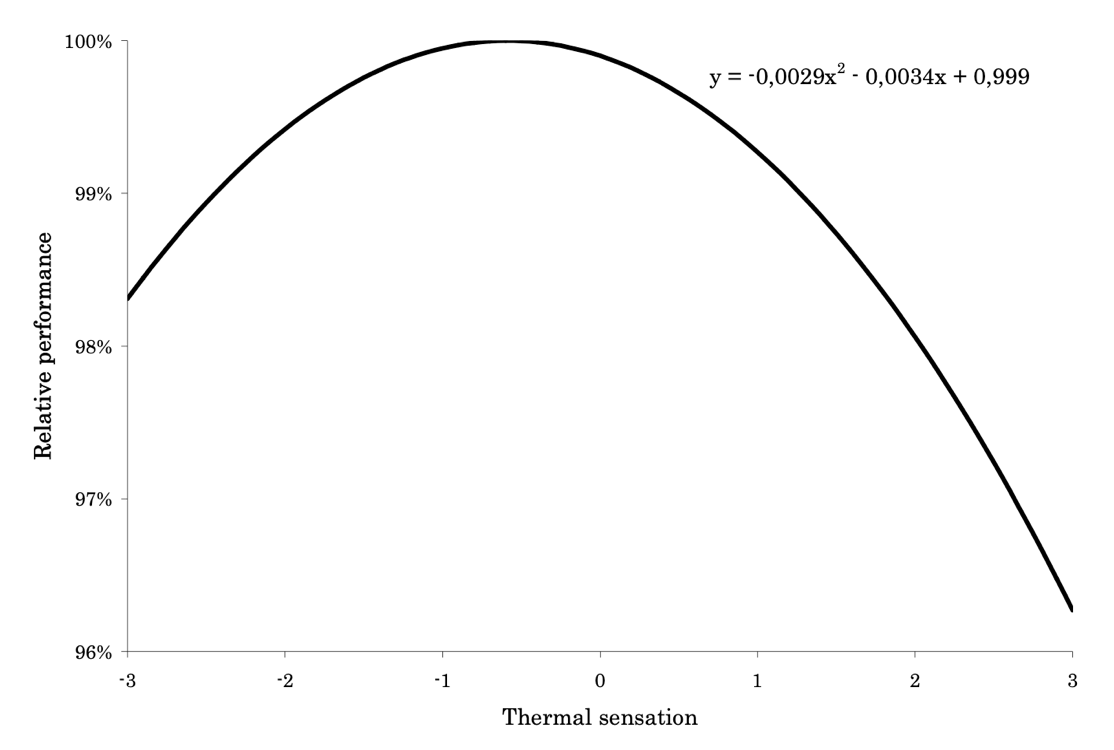
Figure 10.3: Relative performance as a function of thermal sensation. Source: Jensen, 2008.
Lan et al. (2011) also present a correlation between TSV and objectively measured performance, see equation (2). The comparison is based on the results of three climate chamber studies in which temperature and clothing insulation were influenced by the researcher. The subjects did mental tasks and in one study simulated office work at different temperatures. They were also asked for their thermal perception on the 7-point ASHRAE scale (Table 2.1). The relationship is close to that of Jensen (2008):
Relative performance = - 0.035 TSV3 - 0.215 TSV2 + 99.865 (2)
According to both Jensen (2008) and Lan et al. (2011), maximum performance is found at a point slightly below TSV = 0. Therefore, according to Lan et al. (2011), it is better to set the optimal PMV values between -0.5 and 0 rather than between -0.5 and +0.5, as is common in current guidelines. However, this is neither necessary nor desirable for several reasons. Firstly, this will be impossible in practice. Although the temperature can be controlled in such a way that the PMV is -0.5 to 0 for a given assumed mean clo value, occupants will still adjust their clothing to optimise their personal comfort. Moreover, this can lead to overcooling as described in Chapter 1, resulting in an increase in the likelihood of physical symptoms. Also, further narrowing of the temperature boundaries increases the likelihood of more thermal discomfort due to the “narrow temperature boundary paradox” (Section 4.7). It is also less desirable because routine work has been shown to be performed best under slightly cool conditions, but tasks requiring creativity and logical thinking are performed faster under conditions that are perceived as slightly warm (Jensen et al., 2009). Office work today, apart from routine tasks, increasingly requires creativity and logical thinking on the part of employees at all levels. This is also evident from the results of Lipczynska et al. (2018) presented below, where productivity was found to be highest at a TSV that is just slightly higher than neutral. Moreover, equations (1) and (2) above show that at TSV = 0, relative performance is 0.999, i.e. only 0.1% below the assumed optimum.
In summary, performance in varied office work is generally highest with a plateau around TSV=0. How wide this plateau is in general or in particular cases cannot be deduced from Zhang, de Dear & Hancock (2019). If the width is at least as large as for conditioned environments in Figure 10.1, namely 4°C, then a plateau of at least between TSV=-0.5 and TSV=+0.5 can be expected.
There are also studies that show that the relationship of performance with TSV or with the acceptability of thermal sensation is stronger than the relationship of performance with temperature. Research in hot conditions in Singapore (Lipczynska et al., 2018) shows that increasing the cooling setpoint from 23°C to 26°C, supplemented by adjustable ceiling fans (per 1 to 3 occupants) increased the acceptability of thermal sensation from 58% to 91%. At the same time, a significant energy saving was achieved. The change of setpoint had no effect on self-reported productivity. TSV and thermal sensation acceptability did have an effect, not only on self-reported productivity, but also on sleepiness and concentration (Figure 10.4). Self-reported productivity was found to be highest when thermal comfort was slightly warmer than neutral. Also, self-reported productivity was highest when acceptability of the thermal sensation was maximal.
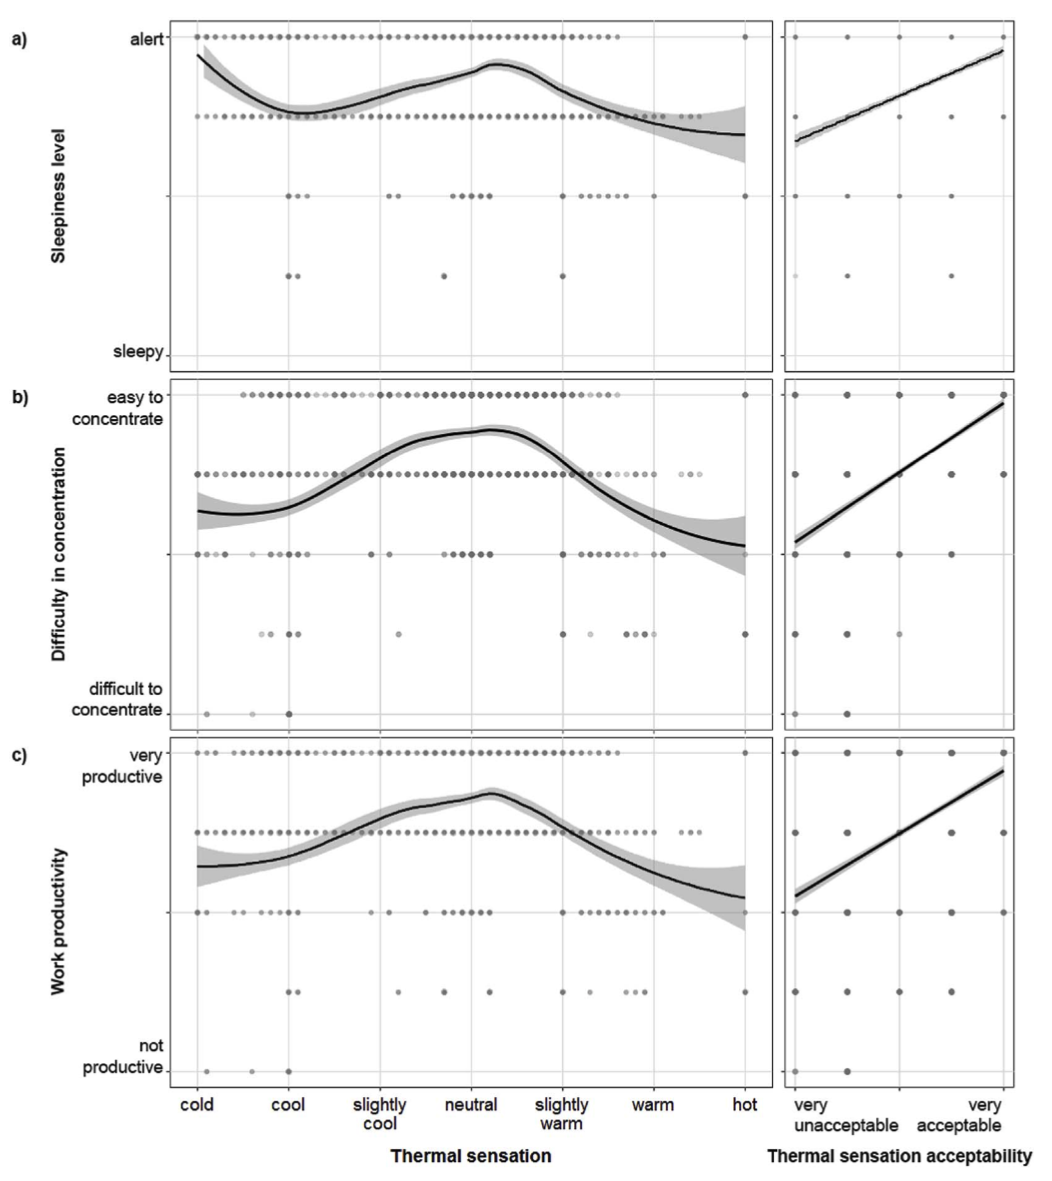
Figure 10.4: The effect of thermal sensation on sleepiness (a), concentration (b) and productivity (c). Source: Lipczynska et al., 2018.
Research in Japan on the effects of COOL BIZ20 in a real work space (Tanabe et al., 2015) showed that self-reported productivity did not correlate with temperature (Figure 10.5), but correlated very strongly with satisfaction with the thermal environment when this was achieved through adaptive features such as fans and lighter clothing (Figure 10.6) The correlation is very similar to that shown in Figure 10.4, the bottom right image.
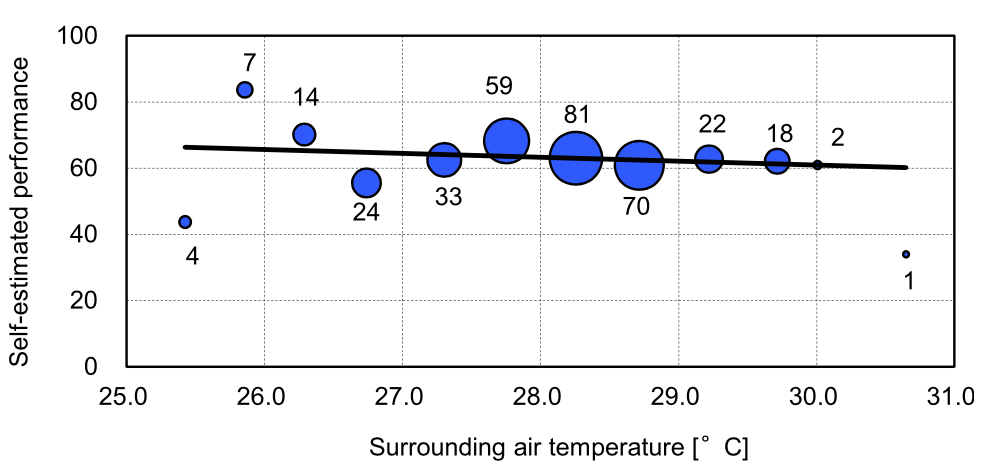
Figure 10.5: The relationship between ambient air temperature and self-reported performance (y = -1.19x + 96.5, R2 = 0.045, p < 0.001, n = 335). Source: Tanabe et al., 2015.
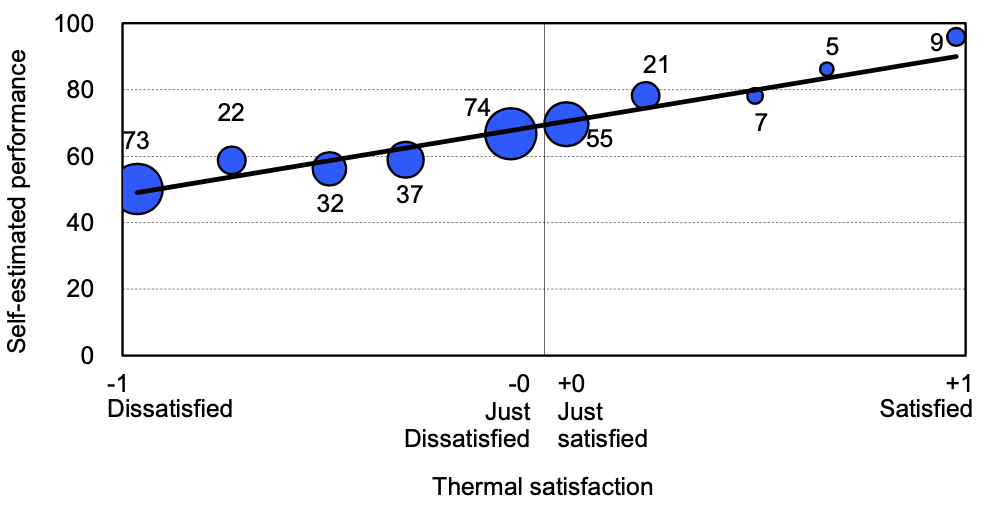
Figure 10.6: The relationship between thermal satisfaction and self-reported performance (y = 21.1x + 69.3, R2 = 0.944, p < 0.001, n = 335). Source: Tanabe et al., 2015.
Also, in a laboratory situation with a relatively high temperature of 28.5°C, subjects were offered different conditions to still feel relatively comfortable, namely, clothing with a lower clo value, a tabletop fan, an air-conditioned shirt, an office chair with a perforated metal seat and back, and combinations thereof. Also, performance was measured objectively through simulated office work. There was no difference in performance with the different conditions. However, objectively measured performance was higher when satisfaction with thermal sensation was higher.
10.4 Performance and open-plan offices
The detrimental effects of open-plan offices on comfort were discussed in Section 5.5, so it is useful here to also examine the influence of open-plan offices on performance. In addition to the influence of temperature, much research has been done into the effects of other aspects of the indoor environment in offices on performance and absence due to illness, such as air quality and noise, in most cases based on objective measurements. Larger office spaces lead to a loss of performance of around 3 to 15% and the as yet unquantified effects of visual problems, lack of view and physical symptoms (Leyten, Raue & Kurvers, 2014). In addition, many of these effects have been investigated in laboratory situations, which may underestimate the effect in practice, as Seppänen et al. (2006) show. In practice, a performance loss of 10 to 20% is possible in larger office spaces. As far as short-term sick leave is concerned, this can be up to 30% higher in larger office spaces than in room offices, partly due to the greater chance of mutual contamination, partly due to weakening of the body through physical symptoms and partly because dissatisfaction with the indoor environment lowers the threshold for calling in sick (Leyten et al., 2014).
10.5 Conclusions on productivity, temperature and thermal comfort
Based on the available research results, it can be concluded that under certain thermal conditions, work performance is highest when users perceive their environment as maximally comfortable or maximally acceptable and that performance decreases as they perceive the environment as less comfortable or less acceptable. This is true for both self-reported and objectively measured productivity. Incidentally, this also applies to other aspects of the indoor environment (Leyten et al., 2014).
In all likelihood, this involves an inverted U-curve with a plateau. Assuming this also applies to naturally ventilated buildings, then performance will be highest at a plateau around the neutral or comfort temperature, which may correspond to higher temperatures than what is neutral or comfortable according to the PMV model. Performance will decrease as the temperature is further below or above the plateau.
As for the width of this plateau, in air-conditioned environments it is about 4C wide. It is likely that in naturally ventilated, free running buildings the plateau will be at least as wide. Sections 7.1, 8.2 and 8.3 showed that in existing buildings there are no differences between the indoor climate categories (A, B, C) in perceived comfort and acceptability of temperature. Since perceived comfort and acceptability of temperature are determinants of employee performance, it is likely that there is also little difference in performance between the three categories. This implies that the plateau extends to category B or even category C. It is argued in Chapter 6 that category B (PPD=20%) is the most realistic bandwidth for newly constructed buildings. Therefore, it is very likely that the plateau extends at least to category B at the top and that in naturally ventilated, free-running buildings that meet category B, no perceptible performance loss due to excess temperature is to be expected.
It is also interesting to know in which environment the performance is higher: in a fully air-conditioned environment without openable windows where the temperature is within the plateau of 20°C to 24°C, or in a naturally ventilated environment at a category B adaptive comfort temperature, all other conditions being equal. In air-conditioned environments there are generally more building-related symptoms such as headaches and fatigue and concentration difficulties than in naturally ventilated/free running environments. The same applies to dissatisfaction with the thermal indoor climate and air quality. Headaches, fatigue and concentration problems lead to a loss of performance, as does dissatisfaction with the indoor thermal environment and air quality (Leyten & Kurvers, 2007). If the generalisation is correct that the highest performance is achieved in an environment that is perceived as the most comfortable, then we might expect that working performance will be higher in well-designed naturally ventilated, free running or hybrid buildings than in fully air-conditioned buildings with the corresponding comfort temperature.
20 The COOL BIZ campaign was initiated by Japan's Ministry of Environment as a means to help reduce Japan's electricity consumption by limiting the use of air conditioning. The Japanese Prime Minister set the example by not wearing a business suit but light, summer clothes. This allowed the office temperature to be set a few degrees higher while maintaining thermal comfort and performance levels.